


1. Introduction
2. Governing Equations
2.1 Non-isothermal saturated water flow
2.2 Mass balance equation
2.3 Non-isothermal deformation
3. Numerical Analysis on Consolidation with Heating
3.1 Model Setup and Analysis Condition
3.2 Input Parameters
4. Analysis Results
4.1 Temperature Distribution
4.2 Consolidation Settlement
4.3 Consolidation Time
4.4 Pore Water Pressure
5. Conclusions
1. Introduction
Infrastructure or reclamation on a soft ground leads to long term settlement problems. When a soil having low permeability such as clay is subjected to an external loading, the load is initially carried by pore fluid rather than the soil skeleton. Consequently, the pore fluid pressure immediately increases. As time progresses, the pore fluid redistribution results in gradual pore pressure dissipation accompanied by gradual transfer of external loading to the soil skeleton. Gradual increase in stresses within soil skeleton resulting from load transfer leads to the change in geometrical configuration of solid assemblage and reduction in pore volume which results in consolidation.
In order to enhance the efficiency of the soft ground improvement, many researchers incorporated various tech-niques which could be applied in the field. In present time, the thermal behavior of soils with heating has received a great deal of attention due to its potential feasibility. There has been a growing interest in the thermal effect on pore fluid pressurization, consolidation deformation, shear strength, permeability, and heat or moisture transfer through geomaterials (Laloui and Cekerevac, 2003). The development of excess pore water pressure during a rapid increase in temperature was investigated by Campanella and Mitchell (1968). The increase of temperature induces volume change and excess pore pressure depending on the stress history of clay (Abuel-Naga et al., 2007). In an experiment on the thermal consolidation of Boom clay, the increase of temperature resulted in decreasing porosity and increasing permeability (Delage et al., 2000). Experi-ments on thermal consolidation of kaolin clay showed that the increase or decrease of final settlement depending on the stress state (Kim and Yune, 2016). The analysis of the experimental results on thermo-mechanical behavior of clayey soil identifies a link between the thermal and the time-dependent behaviors of soil skeleton (Burghignili et al., 2000). Heating and cooling affect volume, pore water pressure, and strength for both NC and OC saturated clays (Graham et al., 2001). Pothiraksanon et at. (2010) compared consolidation settlement of soft Bangkok clay at the field using prefabricated vertical drain (PVD) and prefabricated vertical thermos-drain (PVTD).
Recently, finite element method has been widely used in thermo-mechanical problems. Earliest application of finite element method was studied on isothermal con-solidation problems (Sandhu and Wilson, 1969). Non- isothermal consolidation of deformable porous media is the basis of more recent coupled THM models. Gosavi and Swenson (2006) developed T2STR code for THM problems. Sanavia et al. (2008) presented a new finite element formulation for THM analysis of elastoplastic multiphase materials based on mechanics of porous media. An implementation of a parallel finite element method (FEM) for coupled THM problems in porous media was developed by Wang et al. (2009). Tong et al. (2010) developed and validated the FEM to model the coupled THM processes in rocks. In a numerical approach of Wang et al. (2014), thermal expansion of fluid and solid could induce changes in pore pressure and porosity. Lotfi et al. (2014) compared numerical analysis of other resear-chers by using THM analysis in case of linear elastic and elastoplastic. The double-porosity model was imple-mented in a finite element code to consider the coupled nonisothermal multiphase flow (Sánchez et al., 2016).
In this study, the numerical analysis on the con-solidation by sand drain with heat injection of saturated soft clay was performed using HM and THM model. The effects of heating temperature and sand drain diameter on temperature distribution, consolidation settlement, con-solidation time, and pore water pressure of saturated soft clay were investigated.
2. Governing Equations
Generally, thermal effects can induce a complex interac-tion between THM processes. The thermal loading can induce expansion of pore fluids, solid skeleton, pore space and lead to increase in pore pressure. Governing equations of non-isothermal saturated water flow, mass balance, and non-isothermal deformation are required in finite element code to consider the soil as non-isothermal and saturated conditions. The governing equation of THM model is briefly described.
2.1 Non-isothermal saturated water flow
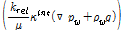
The definition of mass flux of water  is based on Darcy’s law as:

 (1)
(1)
where  is the dynamic viscosity of the fluid and
  is the intrinsic permeability of the porous medium. The dynamic viscosity depends on the type of fluid and temperature and the intrinsic permeability is a function of porous structure. The
  is pore water pressure and
  is the water density. In an unsaturated state, the coefficient of permeability depends on the soil saturation. The relative permeability,
  is defined as the ratio of the permeability at a given degree of saturation to the permeability on saturated state.
  is the vector of gravitational acceleration.
Vapor flow effects need to be considered in non- isothermal processes. The mass flux of vapor is computed based on Fick’s law as:
 (2)
(2)
where  is local equilibrium temperature of porous medium in Kelvin.
  and
and  are hydraulic and thermal diffusion coefficients, respectively.
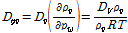
  is the vapour diffusion coefficient in a porous material which depends on tem-perature and gas pressure.
 (3)
(3)
 (4)
(4)
where  is a thermal diffusion enhancement factor.
  is the vapour density and
  is saturated vapour density. The relative humidity
  is defined as:
 (5)
(5)
where  is the specific gas constant for water vapour.
  and
and  are gas and liquid pressures, respectively. The vapour density
  is related to the temperature dependent saturated vapour density by Rutqvist et al. (2001):
 (6)
(6)
where  is the saturated vapor density. It is a tempera-ture dependent parameter which can be obtained from empirical relationships (Wang et al. 2009):
 (7)
(7)
2.2 Mass balance equation
The water mass balance can be written in the following form (Rutqvist et al., 2001):

 (8)
(8)
After the left-hand side terms were expanded, the water mass balance can be derived as:



 (9)
(9)
where  and
and  are the reference compressibility and volumetric thermal expansion of water. The volumetric thermal expansion of water at 293.15 K is 2.1×10⁻⁴ (1/K).
  is the volumetric thermal expansion coefficient of soil grains.
2.3 Non-isothermal deformation
For a representative elemental volume of the soil, the linear momentums balance is given by:
 (10)
(10)
In Eq. (10)  is the well-known Bishop stress (Bishop and Blight, 1963):
 (11)
(11)
where  is the identity vector and χ is an experimentally determined factor which depends on the degree of saturation, the porosity, and the matrix suction. As the pore gas pressure is assumed to be constant and equal to the atmospheric pressure, the pore gas pressure can be neglected. Therefore, the Bishop’s stress (average stress) can be simplified as:
 (12)
(12)
The constitutive relation using the effective stress  is written in the following form:
 (13)
(13)
where  represents the material stress-strain matrix.
  is the total strain of the skeleton and
  is thermal strain caused by temperature increase. The thermal strain can be found from:
 (14)
(14)
where  and
and  are the drained linear thermal expansion coefficient of soil skeleton (1/K) in x, y and z directions, respectively. Khalili et al. (2010) showed that the thermal expansion coefficient of soils grains is the same as the skeletal thermal expansion coefficient of homogenous porous media. Therefore
  . The constitutive relation (13) can be written as:
 (15)
(15)
The governing equation for the deformation model is then obtained:
 (16)
(16)
3. Numerical Analysis on Consolidation with Heating
3.1 Model Setup and Analysis Condition
An experimental research on the thermal consolidation with sand drain was conducted by Kim and Yune (2016). Within consolidation chamber, the vertical load was applied by means of air pressure and controlled by a regulator. The consolidation chamber allowed the installation of sand drain and heating rod at the center of specimen after the specimen reconstitution. The settlement and the internal temperature of the specimen were measured by a linear variable differential transformer (LVDT) and temperature sensors (PT100). The electric heating rod was used to inject the heat during consolidation and controlled by a temperature controller. Fig. 1 (a) presents all components of laboratory test setup for the consoli-dation by sand drain with heat injection. In their test, the effect of heat injection with sand drain on the con-soli-dation of soft ground was investigated. And the injected heat increased final settlement of clayey soil in OC state, whereas in NC state, the magnitude of final settlement was similar in all test conditions.
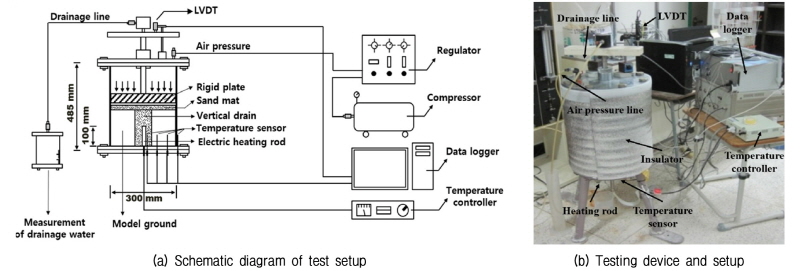
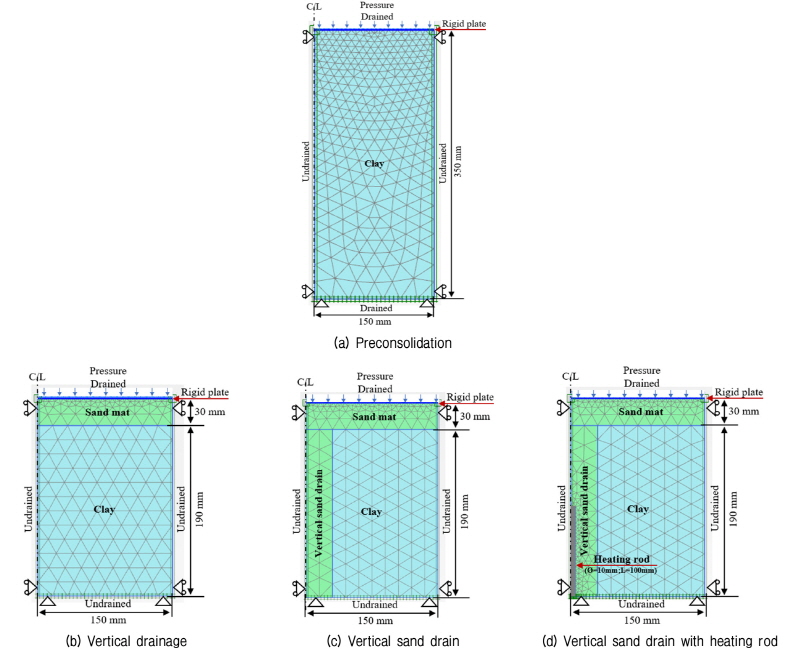
To simulate the consolidation test with the sand drain and heating, Plaxis 2D, commercial software for finite element analysis, was used. Five phases (preconsolidation, sand drain installation, stabilizing, heat injection, and consolidation with heating) were simulated with 15-noded triangular elements as continuous steps in an axisymmetric condition. Detailed analysis conditions and phases were summarized in Table 1. In the preconsolidation phase, the specimen was reconstituted from slurry by vertical loading in vertical drainage condition. In this initial phase, the size of specimen was 350 mm in height and 150 mm in radius as shown in Fig. 2 (a). The top and bottom surface were considered as drainage boundary while the lateral surface was set as undrained boundary as in the case of the test condition. Horizontal displacements were con-strained along the vertical boundaries and vertical dis-placements were constrained at the bottom surface. Additionally, a rigid plate was modeled at the top surface of the specimen to achieve equal strain condition as in the test condition. In this phase, 100 kPa of vertical loading was applied at the top of the rigid plate. At the end of the pre-con-solidation phase, the height of the specimen decreased from 350 to 190 mm. To consider the large deformation in consolidation, the finite element mesh was reconstructed in every analysis step based on adaptive mesh technique. Three test conditions such as vertical drainage (Fig. 2b), radial drainage by sand drain (Fig. 2c), and radial drainage with heating (Fig. 2d), were simulated. For the installation of the sand drain, the specimen was unloaded for 3 hours and the sand drain was inserted at the center of the specimen. The diameter of the sand drain varied from 40 to 80 mm according to test conditions. A sand mat was placed in all constructive models at the upper surface with 30 mm of thickness as in the laboratory test. A rigid plate was also placed at the top of sand mat. The stabilizing phase followed the sand drain installation and 40 kPa of stabilizing pressure was applied at the top of the rigid plate. The boundary conditions were similar to the preconsolidation phase, but the flow boundary at the bottom was changed as undrained condition. Before consolidation, the heat injection was simulated by increasing temperature of the heating rod. The size of heating rod is 100 mm in height and 10 mm in diameter. The heating temperature in modeling was 40 to 60°C. In the heat injection phase, all flow boundaries were closed and the 40 kPa of stabilizing pressure was maintained during this phase. The initial temperature of the specimen was set as 20°C (room temperature). Because the thermal insulator was used at the outside of the chamber as shown in Fig. 1 (b), the wall temperature of the chamber increased to 26°C during the heat injection. Thus, the initial tem-perature of thermal boundaries in numerical analysis was 20°C and it changed following the wall temperature measured in laboratory test. In the consoli-dation phase, 100 kPa (OC state) and 200 kPa (NC state) of vertical stress was applied sequentially.

In total, ten analysis conditions were considered with varying sand drain diameter and heating temperature as summarized in Table 1. To observe temperature, settle-ment, and pore water pressure during consolidation, three investigation points were selected as shown in Fig. 3.

3.2 Input Parameters
The parameters used in modeling are summarized in Table 2. Modified Cam Clay (MCC) and Mohr-Coulomb model were used for kaolin clay and sand, respectively. The basic properties of materials were obtained from the experiment by Kim et al. (2012). The thermal pro-perties of materials were from the research by Etuk et al. (2003). The compression and swelling indexes of kaolin clay were selected from the experimental study by Navarro et al. (2007).

4. Analysis Results
4.1 Temperature Distribution
In experimental study, it is difficult to obtain the tem-perature distribution in a sample because of difficulties in installing sensors inside consolidation chamber subjected to confining stress and water pressure. Especially, in this test, the installing of the sand drain and the heating rod incorporating with several loading and unloading steps make the installing of sensors extremely difficult. Therefore, in this research, temperature distributions and their change over time were investigated by numerical analysis. The initial temperature in the soil was about 20°C and the temperature of heating rod increased to 40 and 60°C according to test conditions. Fig. 4 illustrates one of the representative results of the distribution of temperature according to time steps (from the initial (t = 0 min) to the steady-state (t = 3000 min)) with 40 mm of sand drain diameter and 60°C of heating temperature. The stable temperature distribution in modeling occurs after 1500 min of heat injection.

Fig. 5 shows the increase of temperature at points A and B during heat injection. At point A, higher injection temperature induces higher temperature of soil and the differences of temperature between tests became constant after 30 minutes of heat injection. When compared with RH1-40 where injected temperature was 40°C, about 4 and 9% higher temperature was observed in RH1-60 and RH1-80, respectively. In case of 60°C temperature injection, about 7 and 15% higher temperature was observed in RH2-60 and RH2-80, respectively, compared with RH2-40. Thus, the increase of the diameter of sand drain increases the temperature of the specimen. Moreover, the variation of heating temperature from 40 to 60°C was compared. The increases in the ratio of temperature at point A were about 22, 26, and 30% in 40, 60, and 80 mm. The temperature at point B, however, increased only about 6°C and the difference in each case was almost negligible. The temperature distribution in radial distance at the end of the heat injection is plotted in Fig. 6 and the results are also summarized in Table 3. In Fig. 6, temperature decreases according to radial distance from the center. In case of 40°C, temperature at 75 mm from the center increases 3 and 7% in RH1-60 and RH1-80, respectively, compared with RH1-40. At the same location with 60°C of heating temperature, temperature increases 6 and 14% with RH2-60 and RH2-80, respectively, compared with RH2-40. On the other hand, the temperature inside the sand drain was the same regardless of the sand drain diameter when the heating temperature was the same. The temperature at the outside surface of the specimen was also the same for the same heating temperature.
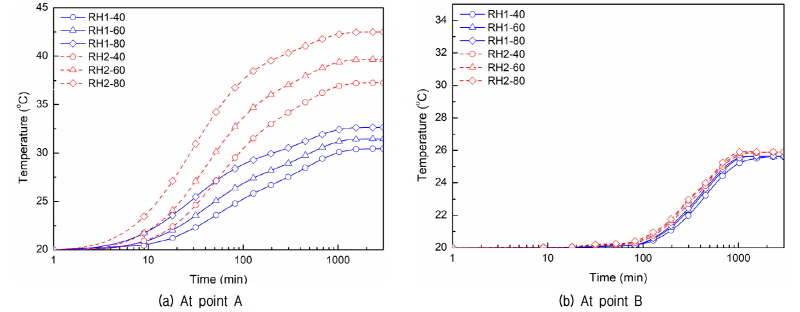
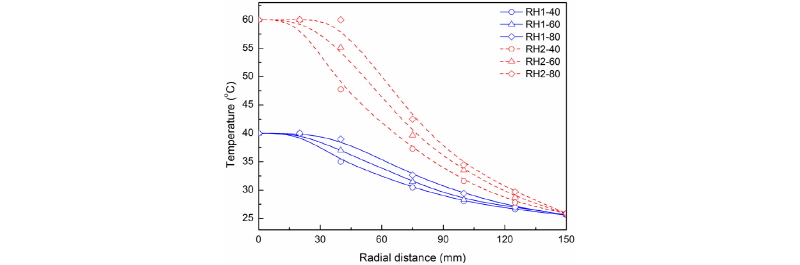
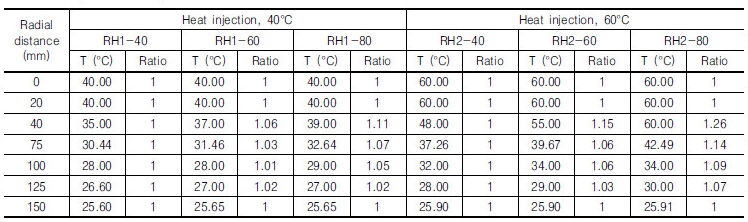
As a result, the temperature inside the specimen increased with the increase of both sand drain diameter and heating temperature, while the temperature inside the sand drain and at the outside of the specimen was identical regardless of the sand drain diameter in each heating temperature. The increase in the ratio of tem-perature in specimen, with increase of heating tempera-ture, was higher compared with the sand drain diameter increase. In addition, the temperature inside the specimen decreased more with the increase of radial distance when it had smaller diameter of sand drain.
4.2 Consolidation Settlement
Consolidation settlements were determined at 95% of degree of consolidation in each loading by using the hyperbolic method. In Fig. 3, point C is the investi-gation point of consolidation settlement. The consolidation settlement during the consolidation phase is plotted in Fig. 7.

In 100 kPa loading (OC state, Fig. 7a), the magnitude of consolidation settlement in radial drainage without heating was higher than that in vertical drainage by about 30%. The heat injection, however, increased the con-solidation settlement by about 330 to 350% compared to the settlement in vertical drainage. Among analyses with heating under 100 kPa loading, the magnitude of consolidation was almost similar with each other and the differences were less than 5%. In 200 kPa loading (NC state, Fig. 7b), the consolidation settlement in radial drainage (with sand drain) was less by about 5, 11, and 18% with R-40, R-60, and R-80, respectively, compared with the settlement in vertical drainage. Similarly, the consolidation settlement with 40 and 60°C of heating temperature was less by about 15, 18 and 23% with 40, 60, and 80 mm of sand drain diameter, respectively, compared with the settlement in vertical drainage. Similar to the result in 100 kPa loading, the differences between the settlement in 40°C and 60°C of heating temperature were less than 3%. In Fig. 8, the final consolidation settlement was compared in each loading. The observed settlement in RH1 and RH2 was higher than that in R and V in OC state (Fig. 8a), while the higher settlement in RH1 and RH2 constrained the subsequent settlement in the next loading stage (Fig. 8b). As mentioned above, the heat injection induced significantly higher settlement in the first loading (100 kPa), while, in the subsequent loading (200 kPa), it did not affect much on settlement. These results agree well with the laboratory test by Kim and Yune (2016) and the oedometer test when the OCR is one (Abuel-Naga et al., 2007). Also, in a full-scale embankment consolidation test using prefabricated vertical thermal drain conducted by Pothiraksanon et at. (2010), an additional settlement was observed when the temperature inside the soft Bangkok clay was increased.

As a result, the heat injection induced significant con-solidation settlement in the first loading (OC state). In the subsequent loading (NC state), however, the effect of the heat injection was not significant. Also, the level of heating temperature (40°C and 60°C) had a negligible effect on the settlement.
4.3 Consolidation Time
The consolidation times for the 95% of degree of con-solidation which were determined by hyperbolic method were compared in Fig. 9. By using sand drain, the con-soli-dation times greatly reduced in average about 92 and 91% in OC and NC states, respectively, compared to the vertical drainage condition. It means that only 8 and 9% of time was required for the consolidation in radial drainage condition. In radial drainage with sand drain, the consolidation time decreased with increasing the diameter of sand drain. The consolidation times in 60 mm and 80 mm of sand drain are, in average, 61% and 41% in OC and 70% and 50% in NC state compared with the time of 40 mm of sand drain. On the other hand, the heat injection did not reduce the consolidation time in OC state because it caused 330 to 350% higher settlement as discussed in Ch. 4.2. In NC state, where heat injection did not induce higher settlement, the con-solidation times were significantly reduced by the heat injection about 47, 47, and 38% in 40, 60, and 80 mm of sand drain diameter, respectively.
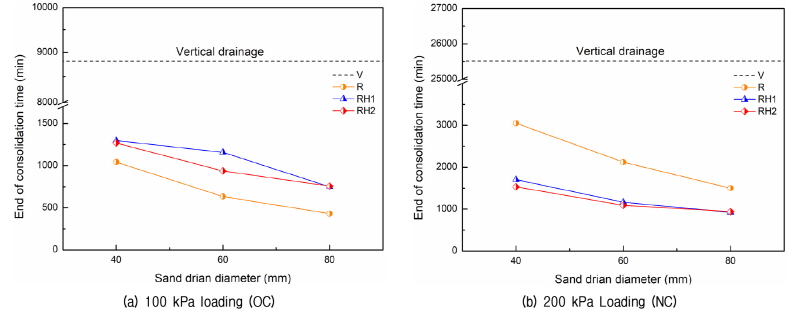
To sum up, the heat injection did not reduce con-solidation time in OC state (100 kPa loading) where high settlement was induced by heating. In NC state (200 kPa loading), however, the heat injection significantly reduced consolidation time where the heat injection did not induce higher settlement. In addition, the sand drain with larger diameter induced more reduction of consoli-dation time.
4.4 Pore Water Pressure
The pore water pressure was measured at the investi-gation point A in Fig. 3. Generally, the pore water pressure in saturated clay increases upon the load applied on it. Fig. 10 presents the results of pore water pressure in numerical analysis of consolidation of soft clay. The increase of pore water pressure was the same as the applied pressure in cases without heating. However, with the heat injection, pore water pressure increased up to about 1.9 and 1.2 times of the applied pressure in OC (Fig. 10a) and NC state (Fig. 10b), respectively.
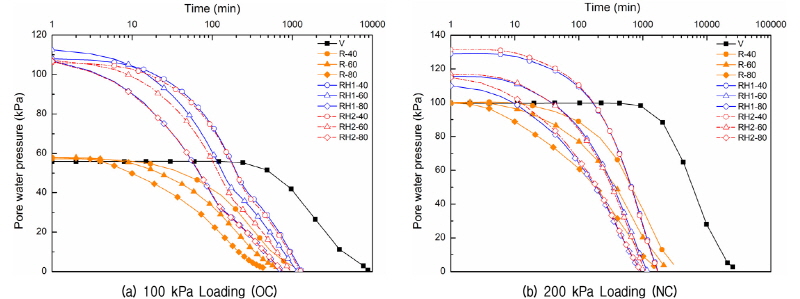
In general, the thermal expansion of solid and liquid is induced with the increasing temperature. The develop-ment of excess pore water pressure during a rapid increase in temperature was identified by Campanella and Mitchell (1968) and Tawati (2010). In their research, it was con-cluded that the increase in pore water pressure would occur in most soils with increasing temperature, even when the soil was under drained conditions. In OC state (100 kPa loading), the pore water pressure was very high at the start of consolidation because of the thermal expansion of solid and liquid by heating.
During consolidation, pore water pressure dissipated to zero at point A. However, because of residual pore water pressure near undrained boundary, about 20% higher pore water pressure than applied pressure was observed at the start of 200 kPa loading (NC state). Even when the higher pore water pressure by heating was observed, it dissipated very fast, thus at 300 minutes in Fig. 10, the differences in pore water pressure of 40, 60, and 80 mm of sand drain diameter with heating were only 2, 6, and 8% of the case without heating in OC state. In NC state, the differences were 7, 8, and 7% in 40, 60, and 80 mm of sand drain diameter, respectively. Considering the level of heating temperature (40°C and 60°C), the difference of heating temperature had a negligible effect on the magnitude of pore water pressure in OC and NC state.
In consolidation with heat injection, the thermal ex-pan-sion of solid and liquid by heating resulted in the excess pore water pressure higher than the applied pressure in OC state. In NC state, the difference between the applied pressure and the excessive pore water pressure was reduced to 20%. The dissipation rate of pore water pressure by heating was very fast compared with the consolidation without heat injection in both OC and NC states.
5. Conclusions
To investigate the effect of heating on the behavior of soft clay, numerical analysis was performed for the consolidation of soft clay with and without heat injection through sand drain. The conclusions were drawn as follows:
(1)The higher heating temperature and the larger diameter of sand drain induced higher temperature of soil. Moreover, the effect of temperature increase was greater than the sand drain diameter increase. Also, the temperature inside the specimen decreased accord-ing to radial distance and the decreasing ratio was higher for the case with smaller diameter of sand drain. However, the temperature inside the sand drain and at the outside of the specimen was the same regardless of the sand drain diameter at each heating temperature.
(2)In OC state, the consolidation with heat injection induced the additional settlement about 330 to 350% compared to the consolidation with vertical drainage, while the effect of the heat injection on the con-soli-dation settlement was not significant in NC state. However, the effect of the magnitude of heating temperature (40°C and 60°C) on settlement was negligible in both OC and NC states.
(3)The usage of sand drain greatly reduced the con-solidation time in about 92 and 91% in OC and NC states, respectively, compared to the vertical drainage condition. On the other hand, the heat injection did not reduce consolidation time in OC state (100 kPa loading) where high settlement was induced by heating. In NC state (200 kPa loading), however, the heat injection significantly reduced consolidation time where the heat injection did not induce higher settlement. In addition, the sand drain with larger diameter induced more reduction of consolidation time.
(4)In consolidation with heat injection, the thermal ex-pansion of solid and liquid by heating resulted in the excess pore water pressure higher than the applied pressure in OC state. In NC state, the difference between the applied pressure and the excessive pore water pressure was reduced to 20%. However, these higher pore water pressures caused by heating dissi-pated fast compared with the consolidation without heat injection in both OC and NC states.