


1. 서 론
2. 기존 문헌 조사
2.1 주문진 모래
2.2 낮은 구속응력()에서의 전단강도 특성
2.3 Membrane 효과 보정
3. 배수 삼축압축(CD Triaxial Compression) 시험
3.1 시험 장비 및 시료
3.2 삼축 압축시험
4. 시험 결과 분석
4.1 응력-변형률 관계
4.2 내부마찰각() 산정
4.3 변형계수(deformation modulus) 특성
5. 결 론
1. 서 론
원위치의 낮은 응력상태에서 사질토 지반의 거동에 대한 연구는 지표 혹은 지표에 가까이 설치되는 얕은 기초 지반의 안정성, 제방 및 호안, 사면의 얕은 파괴, debris 파괴, 혹은 액상화 등의 해석에 있어 매우 중요하다. 특히 기초 및 제방의 지지력, 터널의 주변지반 거동 등을 파악하기 위하여 수행하는 각종 모델실험(1g-test)의 결과를 분석하는데 있어 매우 낮은 응력에서의 전단 및 변형특성을 명확히 파악 할 필요가 있다.
일반적으로 모래 시료는 전단시 팽창과 수축이 발생하며, 전단강도(내부마찰각,  )는 상대밀도(relative density)가 클수록 또는 구속응력(effective confining stress
  )이 작을수록 증가하는 경향을 나타낸다. 그러나 매우 낮은 구속응력 상태에서 시행하는 모델실험은 높은 stress level에서 관찰되는 거동과 상당한 차이가 있다. 그 이유로서는 Ponce and Bell(1971)는 입자간의 겉보기 점착력으로 간주하였으며(Lancelot et al., 2006), 또한 재료의 본질적인 특성과 경계조건과 같은 외적인 요소에 의해 발생한다고 알려져 있다(Macari-Pasqualino et al., 1994).
또한 응력-변형률 관계는 일반적으로 비선형관계로서, 변형(탄성)계수(Intial or Secant modulus)는 stress level이 peak(혹은 ultimate) strength 에 도달할 때까지 감소하는 경향을 보이며, 낮은 구속 압력 하에서는 전단시 dilatancy effect로 축차응력(deviator stress)을 증가 시켜 상대적으로 큰 전단강도를 나타낸다. 한편 매우 낮은 구속응역에서 삼축 압축 시험을 실시하는 경우에는 전단시 필터재(paper drains)의 영향, 시료의 단면적의 변화 및 membrane의 효과 등에 대한 보정이 필요하다. Greeuw, et al.(2001)에 의하면 membrane의 효과를 고려하여 1.0~2.7kPa 정도의 보정이 필요하며, 일반적으로 매우 낮은 구속응력의 경우에 축차응력(deviator stress)의 약 5~15% 정도의 보정이 필요한 것으로 알려져 있다(Fukushima et al., 1984). 따라서 본 연구에서는 건조된 주문진 표준사를 대상으로 배수 삼축압축 시험을 통하여 매우 낮은 구속압력(< 20kPa)에서의 강도 및 변형특성을 규명하고자 한다.
 (kN/m3)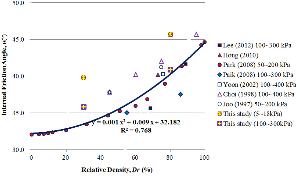
 ) on the relative density (
 ) for Jumunjin sands
2. 기존 문헌 조사
2.1 주문진 모래
국내 대표적 표준사인 주문진 모래의 경우 입도, 점토함유량 및 단위중량에 대한 규정(KSL 5100)이 있으나 물리적, 역학적 특성에 대한 특별한 기준은 없으므로 각각의 연구자마다 실험 목적에 따라 별도의 시험을 실시하고 있는 실정이다. 그 결과 제품에 따라 토립자의 형상은 물론 Table 1과 같이 입도, 비중, 건조 단위중량에 다소 차이가 있다.
이러한 시료에 대하여 삼축 압축시험(CD test)으로 결정한 전단강도(내부마찰각) 또한 Fig. 1과 같이 2차 회귀곡선(regression curve)에 대한 결정계수(R2)가 0.768로서 분산된 분포를 나타내고 있으며 개략적으로 상대밀도( ) 따른 내부마찰각의 관계식은 식 (1)과 같이 나타낼 수 있다. 한편 본 연구에서 산정된 내부마찰각(
 )이 낮은 구속응역(5kPa~18kPa)에서 상대적으로 큰 값을 나타내고 있는 것을 알 수 있다.
 (1)
(1)
2.2 낮은 구속응력( )에서의 전단강도 특성
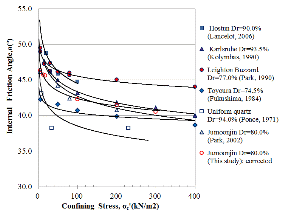
기존에 제안된 구속응력 관련 연구에서는 Fig. 1의 범례에서 보는 바와 같이 최소 구속응력( )이 50~100kPa로서 20kPa이하의 낮은 구속응역에서의 전단강도의 값과는 상당한 차이가 있으며, 국내외 문헌 조사를 통하여 낮은 구속응역 하에서의 모래의 조밀도에 따른 전단강도의 분포를 Fig. 2에 나타내었다.
Fig. 2에서 보는 바와 같이 내부마찰각( )은 구속응력이 낮을수록 전반적으로 로그(log) 함수로 증가하는 경향을 나타내고 있는 것을 알 수 있다.
2.3 Membrane 효과 보정
|
|
(a) Dense sand | (b) Loose sand |
Fig. 2. Distribution of internal friction angles ( | |

 ) on confining stresses (
 ) for various sands
삼축 압축시험 시에 발생하는 오차의 원인으로서 필터재(paper drains)의 영향, 시료의 단면적 변화 및 membrane의 효과 등 있으며 최신 시험 장비의 보급으로 membrane 효과를 제외하고 자체 보정이 가능하며 오차의 범위도 작다. 낮은 구속 압력 하에 시행하는 삼축 압축시험의 경우에 membrane은 매우 복잡한 형상을 나타내며 membrane의 굴곡에 따라 상대적으로 큰 축차응력이 발생하며, ASTM D7181(2011)에서는 membrane의 강도로 인하여 축차응력(deviator stress)이 5% 이상 차이가 있을 경우 수직응력에 대하여 보정토록 하고 있다. 최초로 Henkel and Gilbert(1952)가 전단시의 membrane의 강도에 대하여 Compression shell 이론 및 Hoop stress 이론을 제안하였으며, 일축압축 강도와의 비교를 통하여 London clay의 경우 2.1~9.7kPa의 membrane의 강도를 확인하였다. 이후 Duncan and Seed(1967), La Rochelle 등(1988), Greeuw 등(2001) 및 Evans(2005) 등의 학자들에 의해 membrane의 강도에 따른 보정 방안이 수정 제안되었으며 구속응력이 50kPa 이하인 경우에 보정토록 제안하고 있다.
이러한 제안식 중에서 입력변수가 수평 변형률(εh)인 경우 정확한 측정이 곤란하고, buckling으로 인하여 시료 위치에 따라 값을 달리하므로 적용성에 한계가 있다. 한편 ASTM D7181-11의 제안식은 아직 콘센서스가 이루어지지 않고 있다고 명기(Note 25)하고 있으며, Compression shell 이론을 근거로 하고 있다. 따라서 본 연구에서는 입력변수가 축 변형률(ε1)로서 배수 압축시험(CD test)에 적용 가능한 Compression shell 이론의 ASTM D7181-11 제안식과 Hoop tension 이론식(Henkel and Gilbert, 1952; Evans, 2005) 및 별도 경험식의 Hollow cylinder model(Greeuw et al., 2001)로 부터 각각 membrane 보정 응력을 산정하여 평균값을 적용하였으며 그 제안식은 각각 다음 식 (2)~식 (4)와 같다.
ASTM D7181-11 제안식
 (2)
(2)
여기서,  : membrane 보정 응력, 축차응력에서 차감(kPa)
 : 압밀 후 시료의 직경(=154.12mm)
 : membrane youngs modulus(=1,520kN/m2)
 : membrane 두께(=0.3mm)
 : 축 변형률
Hollow cylinder model(Greeuw, 2001)



 (3)
(3)
여기서,  : membrane 보정 응력(kPa)
E : membrane stiffness(=1,520kN/m2)
t : membrane thickness(=3.0mm)
D : 시료 직경(=154mm)
 : axial strain
 : coefficients(α=0.38
  0.19, β=0.19
 0.08)
0.08)
Hoop tension theory(Henkel and Gilbert, 1952; Evans, 2005)
 (4)
(4)
여기서, D : 단위 길이 당 membrane stiffness(=0.48kN/m2/m)
3. 배수 삼축압축(CD Triaxial Compression) 시험
3.1 시험 장비 및 시료
삼축 압축시험 장비는 Geocomp사에서 제작한 LoadTrac- II 및 FlowTrac-II system을 이용하였으며 전자동 전용 software를 사용하여 측정 및 기록하였다. 시험 재료는 주문진 표준사를 사용하였으며 제반 물리적 특성은 Table 2와 같다.


3.2 삼축 압축시험
본 연구에서 낮은 구속응력에서의 강도 및 변형 특성을 평가하기 위하여 건조된 표준사를 이용하여 배수 삼축압축(CD Triaxial Compression)시험을 실시하였으며, 구속응력( )은 5, 13, 18, 100, 200, 300kPa로 하고, 조밀도에 따른 거동을 평가하기 느슨한 모래(
 =30%) 및 조밀한 모래(
 =80%)에 대하여 각각의 삼축 압축시험을 실시하였다. 공시체의 지름은 72.9mm, 높이 154mm로서 전단변형률은 0.15%/min로 재하하였다.
 (mm)
(mm) (mm)
(mm)4. 시험 결과 분석
4.1 응력-변형률 관계
주문진 표준사에 대하여 배수 압축시험을 수행한 결과 조밀(Dr=80%), 느슨(Dr=30%)한 시료에 대한 응력- 축변형률 곡선은 Fig. 3과 같다.
Fig. 3에서 보는 바와 같이 구속응력( )이 증가 할수록 축차응력(deviator stress)은 증가하고 있으며, 조밀한 모래(a)의 경우에 dilatancy 영향으로 느슨한 모래 보다 상대적으로 peak strength 및 strain softening의 경향을 보이고 있으나, 느슨한 모래(b)의 경우에는 전반적으로 strain hardening(ultimate strength) 거동을 나타내고 있다. 특히 조밀도와 상관없이 낮은 구속응력(
 )에서는 peak strength의 형상을 확인 할 수 있다.
4.2 내부마찰각( ) 산정
) 산정
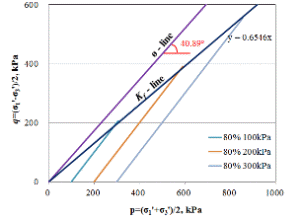
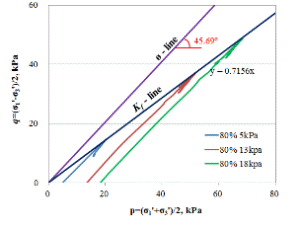
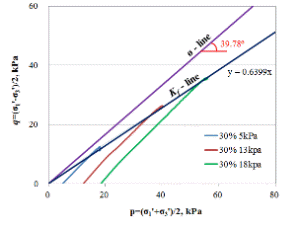
배수 삼축 압축시험(Drained triaxial compression test)의 결과로 부터 stress path를 도시하면 Fig. 4와 같으며, 점착력을 0으로 하고 파괴시의 평균 주응력(pf)과 전단강도(qf)의 값을 직선화한 추세선으로  의 기울기를 갖는 kf 선(M-line)과 파괴포락선(
 -line)을 도시하였다. 그림에서 보는 바와 같이 조밀도와 상관없이 낮은 구속응역(5kPa~18kPa)의 경우가 상대적으로 높은 구속응력(100kPa~300kPa) 보다 내부마찰각(
 )이 4.0°~4.8° 정도 큰 값을 나타내고 있는 것을 알 수 있다.

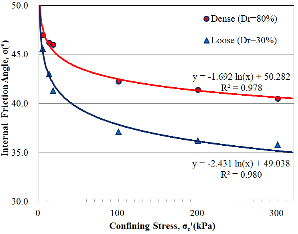
또한 관련 문헌들과 동일하게 배수 삼축 압축 시험 결과에 따라 각각의 구속응역에 대한 Mohr’s circle로 부터 점착력을 0으로 하여 내부마찰각( )을 식 (5)로부터 결정하여 Fig. 5에 나타내었다.
 (5)
(5)
Fig. 5에서 주문진 표준사의 경우 구속응력( )이 작을수록 내부마찰각(
 )은 로그(log) 함수로 증가하는 것을 알 수 있다. 그러나 매우 낮은 구속응력(
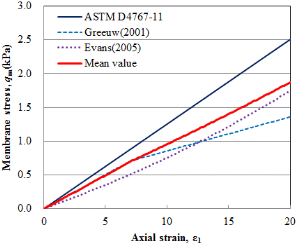
 < 50kPa)의 경우에는 membrane 강성의 영향이 상대적으로 크므로 membrane 효과에 대한 보정이 필요하다. 따라서 membrane의 보정 응력을 식 (2)~식 (4)으로부터 각각 산출하여 축변형률에 따른 membrane의 응력 분포를 도시하면 Fig. 6과 같다. Fig. 6에서 동일한 시료의 직경, membrane 두께 및 강도에 대하여 단지 축변형률(
 )에 직접 비례하므로 최대 축변형률 20%에서 각각 2.51kPa, 1.36kPa 및 1.75kPa로 산정되었으며, membrane 응력이 평균 최대 1.87kPa(축변형률 20%)이 작용하여 축차응력의 9.5%(
 =5.0kPa) 정도의 오차가 발생하고 있다.
 ) and confining stresses (
 ) on Jumunjin sand
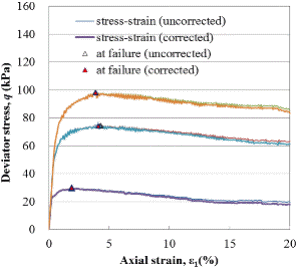
따라서 낮은 구속응력(<20kPa)에 대하여 이들 평균의 membrane의 응력을 축차응력(q)에서 차감하여 응력( ) - 변형률(
 ) 곡선을 도시하면 Fig. 7과 같다. Fig. 7에서 strain hardening 경향을 보이는 시료(느슨 모래,
  =13kPa, 18kPa)는 membrane 응력이 변형률의 함수이므로 큰 축변형률(최대 17.6%)에서 ultimate strength가 산정되어 membrane의 효과가 크게 작용하고 있으며, peak strength가 있는 경우에는 파괴시 축변형률(1.9~4.1%)이 상대적으로 적으므로 membrane의 효과가 비교적 적은 것을 알 수 있다. 또한 이러한 membrane의 효과를 반영하여 구속응력(
 )에 따른 내부마찰각(corrected
  )의 분포를 Fig. 8에 나타내었다

 ) - strain (
 ) curves after membrane correction
Fig. 8에서 구속응력( )이 5kPa(corrected)인 의 경우 membrane 효과로 인하여 조밀한 모래는 내부 마찰각(
 )이 0.66°, 느슨한 모래는 0.47° 정도 크게 측정됨을 알 수 있다. 단. 느슨한 모래에서 구속 압력이 13kPa 및 18kPa인 경우에 내부 마찰각(
 )의 저하가 각각 2.4° 및 1.7°로서 상대적으로 큰 값을 나타나고 있어 큰 축변형률(12.1~17.6%)에서 ultimate strength가 산정되므로 membrane의 효과가 크게 작용하는 것을 알 수 있다. 따라서 membrane 응력이 보정된 내부마찰각(
 )에 대하여 구속응력(
 )에 대한 분포를 도시하면 Fig. 9와 같으며 대수 회귀곡선(log regression curve)의 결정계수(R2)가 0.934~0.972로서 비교적 분산도가 적으며, 향후 많은 자료를 축적 할 경우 더욱 상관도를 높일 수 있을 것으로 판단된다. 이로부터 기존 자료(Fig. 2)와 주문진 표준사에 대하여 회귀 분석한 결과는 Table 3과 같다.
Table 3에서 결정계수(R2)가 0.9 이상의 상관도를 갖는 회귀분석 결과로 부터 구속응력( )과 내부마찰각(
 )의 관계식을 식 (6)과 같이 나타낼 수 있다.
 (6)
(6)
여기서, a의 값은 조밀 모래의 경우 49.4~56.2kPa 및 느슨 모래는 42.3~49.9kPa이며, b계수는 조밀 모래 1.52~2.54, 느슨 모래는 1.60~2.33의 범위에 있는 것으로 산정되었다.
|
Fig. 8. Distribution of internal friction angles ( |
|
Fig. 9. Influence of confining stress ( |

 ) corrected for membrane effect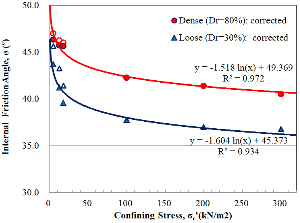
 ) on the corrected internal friction angles (
 ) for Jumunjin sand
  ) on confining stress (
 )
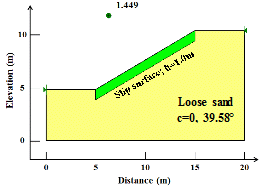
)한편 낮은 응력상태에서의 Membrane효과와 관련한 예로서 Fig. 10과 같이 느슨한 사질토 지반의 무한사면(경사각 30°, 토피 1.0m,  =18kPa)에 대한 안정해석(Slope/W, 2012)을 수행한 결과 Membrane 효과에 대한 보정 전,후의 안전율의 차이가 약 0.1 정도의 차이가 있는 것으로 평가되었다.
4.3 변형계수(deformation modulus) 특성
낮은 구속응력( ) 하에서 membrane의 효과를 보정한 응력(
 ) - 변형률(
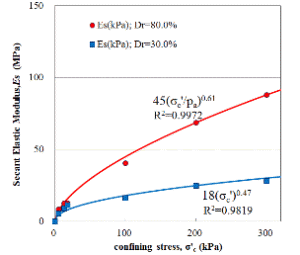
 ) 곡선(Fig. 7)으로부터 산출된 초기 탄성계수(Ei; Initial elastic modulus 또는 Young’s modulus)와 변형계수(Es, E50; Deformation modulus 혹은 Secant elastic modulus)의 분포는 Fig. 11과 같다. 단, 초기 탄성계수(Ei)는 0.1%의 축변형률을 기준으로 산정하였으며, 변형계수(Es)는 Peak strength의 경우는
  , Ultimate strength의 경우 Failure rato(Rf)= 0.9(Schanz, 1999)로 하여
  / Rf인 축차응력(deviator stress; corrected)의 1/2 값을 변형률에 대한 비로부터 결정하였다.
구속응력에 대한 변형 특성과 관련하여 Janbu(1963)는 등방, 유효 구속응력( )과 초기 탄성계수(
 )의 관계식을 식 (7)과 같이 정의하고
  =50~500, n=0.35~0.55로 제안하였으며, Duncan and Chang(1970)은 식 (7)과 동일하나 unloading/reloading elastic modulus(
 ) 및 elastic unloading/reloading parameter(
 )를 사용하였다.
 (7)
(7)
여기서,  : 무차원의 modulus number
 : 대기압(=100kPa)
n : modulus exponent 혹은 power
또한 Lambe and Whitman(1979)에 의하면 구속응력( )이 증가하면 변형계수(Es)는
  만큼 증가하며 지


 )
)수 n의 값은 0.4~1.0 범위에 있으며, 일반적으로 0.5 값을 취한다고 제안하였으며, Hardin and Richart (1963), Hoque(1998) 및 Correia(2007) 등은 초기 탄성계수( )에 영향을 미치는 요소가 구속응력(
 )과 간극비(e)이며, 간극비(e)의 함수 “
 ”를 추가하여 식 (8)과 같이 제안하였다.
 (8)
(8)
여기서,  및
및  이며, B의 값은 시료의 고유정수.
식 (8)에서 간극비 함수( ) 결정시 주문진 표준사에 대한 고유정수(B)의 값이 불확실하므로 적용성에 문제가 있으므로 본 연구에서는 구속응력(
 )과 변형계수(Ei, Es)의 관계를 식 (9)와 같이 설정하였다.
Ei혹은Es= (9)
(9)
여기서, 
Fig. 11에서 보는 바와 같이 주문진 표준사의 경우 A 및 n의 값은 Table 4와 같으며 지수(n) 은 조밀한 모래(Dr=80%)의 경우에는 0.61 및 느슨한 모래(Dr=30%)는 0.47를 나타내고 있다. 또한 관련 문헌으로부터 조사된 지수(n)의 값의 분포를 도시하면 Fig. 12와 같으며 전반적으로 다소 분산된 분포를 보이고 있으나 0.45~0.69의 값으로 Lambe and Whitman(1979)이 제안한 0.4~1.0의 범위 내에 분포하는 것을 알 수 있다.
 for Jumunjin sand
5. 결 론
본 연구에서는 매우 낮은 구속응력( )에서의 강도 및 변형 특성을 평가하기 위하여 건조된 주문진 표준사를 대상으로 배수 삼축 압축시험(Drained Triaxial Compression Test)을 실시하였으며 시험 결과에 대한 비교 분석을 통하여 다음과 같은 결론을 얻었다
(1)주문진 표준사의 전단강도 특성은 구속응력( )이 작을수록 내부마찰각(
 )은 로그(log) 함수로 증가하며 매우 낮은 구속응력(
 < 20kPa)에서 membrane 응력에 대한 보정을 실시한 결과 구속응력(
 )과 내부마찰각(
 )의 관계식은 다음과 같다.


(2)주문진 표준사에 대한 기존 문헌 조사 결과 상대밀도( )에 대한 내부마찰각(
 )의 관계식은 최소 구속응력(
 )이 50~100kPa인 경우에 다음 식과 같이 이차방정식으로 나타낼 수 있으나 20kPa 이하의 매우 작은 구속응력(
 )하에서는 높은 구속응력 보다 내부마찰각(
 )이 4.0°~4.8° 정도 큰 값을 나타내고 있어 적용성에 한계가 있다.

(3)낮은 구속응력( )에서의 전단강도 특성에 대하여 기존 문헌 조사를 통하여 전반적으로 구속응력(
 )이 낮을수록 전반적으로 로그(log) 함수로 증가하는 경향을 보이는 것을 확인하였으며, 주문진 표준사의 응력-변형률 관계로부터 dilatancy의 영향으로 낮은 구속응력(
 )에서 peak strength 및 strain softening 거동이 확인되었다.
(4)주문진 표준사의 변형 특성으로서 구속응력( )이 작을수록 변형계수(Es)는 (
 )n 만큼 감소하고 다음과 같은 관계식으로 정의되며, 문헌 조사를 통하여 모래인 경우 지수(n)의 값은 0.45~0.69 범위 내에 있으며, 주문진 모래의 경우 조밀 모래는 0.61, 느슨 모래는 0.47의 값을 나타내었다.
 [MPa]
[MPa]
 [MPa]
[MPa]
(5)삼축시험에서 매우 낮은 구속응력(<20kPa)의 경우 membrane 효과가 강도 및 변형 특성에 영향을 끼치며 특히 strain hardening 경향을 보이는 경우에는 membrane의 응력이 상대적으로 크게 작용하므로 반드시 보정이 필요하다. 예로서 느슨한 사질토에 대한 무한 사면 안정해석 결과 약 0.1 정도의 안전율의 차이가 있으므로, 낮은 구속응력에서의 삼축 압축시험에서 ultimate strength를 보이는 경우에 membrane의 효과를 반영하지 않으면 다소 과대평가 될 우려가 있는 것으로 판단되었다.
(6)본 연구는 매우 낮은 구속응력에 있어 강도 및 변형 특성에 관한 시험적 접근방안으로 국내 표준사인 주문진 모래를 이용하였으며, 향후 많은 자료 축적과 병행하여 얕은 사면 및 debris 파괴에 대한 안정성 검토 등을 위하여 화강풍화토와 같은 국내 일반적인 시료를 대상으로 지속적인 연구가 필요할 것으로 판단된다.