

1. Introduction
2. Methodology
2.1 Mass Balance Equation
2.2 Soil Water Characteristic Curve Model
2.3 Swelling Model
2.4 Finite Element Analysis
2.5 Swelling Simulation According to Constraint Conditions
2.6 Model Validation
3. Analysis of Swelling behavior according to Experimental Conditions
3.1 Swelling Pressure according to Geometrical Shapes of Buffer Blocks
3.2 Swelling Pressure according to Dry Density of Buffer Material
4. Conclusions
1. Introduction
One of the key characteristics of buffer materials used in high-level radioactive waste disposal facilities is their sealing ability, which prevents groundwater infiltration from the surrounding rock formations into the disposal space (Yoon et al., 2023). Therefore, bentonite is considered a candidate buffer material in most countries. Bentonite exhibits swelling behavior, which increases the interlayer distance between particles when it comes into contact with water. As the groundwater infiltrates, swelling strain occurs, filling the gaps between the rock in the disposal hole, buffer material, and disposal canister. Once these gaps are completely filled, swelling pressure is exerted on the surrounding structures.
Such buffer materials swell and become saturated with groundwater inflow through fractures in the surrounding rock formations, serving as a barrier to prevent additional groundwater infiltration. However, excessive swelling pressure can negatively affect the mechanical stress on the surrounding rock and disposal canister, thereby compromising the long-term integrity of disposal facilities. Conversely, insufficient pressure may favor advection over diffusion, potentially increasing radionuclide leakage (SKB, 2010) and causing microbial-induced corrosion of disposal canisters (Bengtsson and Pedersen, 2017). Therefore, it is crucial to design a buffer material with an appropriate swelling pressure.
Various experiments were conducted under different conditions to measure the swelling pressures of buffer materials. It is generally known that as the dry density of the buffer material increases, the swelling pressure also increases (Schanz and Al-Badran, 2014; Lu et al., 2022). However, swelling pressure experiments for buffer materials involve various experimental variables, such as the initial degree of saturation, block size, montmorillonite content, and constraints on the duration of the experiments. Thus, research is currently underway to predict swelling pressure through numerical analysis. While several numerous fundamental studies using numerical analysis have explored the swelling simulation of bentonite buffer materials, and substantial research strides have been made (Kim et al., 2021; Narkuniene et al., 2022), there remains an inadequacy in comprehensively analyzing the swelling behavior of bentonite buffer materials in accordance with initial specimen conditions. Specifically, there is a need for a thorough examination of the swelling patterns in samples exposed to diverse experimental conditions, including the initial specimen conditions and the geometric shape of the buffer block. Numerical analysis serves as a valuable tool for scrutinizing aspects that may be challenging to validate experimentally. Consequently, it holds great importance to assess in advance the potential impact on experimental conditions based on such analyses.
In this study, a numerical analysis model was developed using a nonlinear elastic model to simulate the swelling behavior of Kyeongju bentonite (KJ-II) buffer material, which is a type of calcium bentonite. The predictive reliability of the model was validated by comparing it with the experimental swelling pressure data obtained by us (Disposal Safety Evaluation R&D Division at Korea Atomic Energy Research Institute, KAERI). Subsequently, the swelling behaviors of the KJ-II bentonite buffer blocks were compared and analyzed under various experimental conditions, including the geometric shape of the buffer blocks and the initial dry density of the buffer material.
2. Methodology
2.1 Mass Balance Equation
In this study, the swelling behavior of the compacted bentonite buffers was evaluated using the commercial software COMSOL Multiphysics PDE module. Instead of employing a complex two-phase flow model, Richards’ equation can effectively and reasonably simulate the hydromechanical behavior of a compacted bentonite buffer during hydration (Richard, 1931). The hydration process in an initially unsaturated bentonite block was modeled using the mass balance equation of water. The main variable considered in this equation is the pressure of the liquid phase. This model assumes that the pore space contains only air at atmospheric pressure and is not occupied by water. The governing equations for this configuration are as follows:
where ρw represents the density of water (kg/m3), g is the gravitational acceleration (m/s2), Se is the effective saturation (-), pl is the pore water pressure (Pa), t is the time (s), ks is the saturated hydraulic conductivity (m/s), kr is the relative hydraulic conductivity (-), μ is the dynamic viscosity (Pa·s), n is the porosity, χf is the compressibility of water, and χp is the compressibility of the bentonite sample, defined as the reciprocal of the bulk modulus. Furthermore, Qm represents the external source in response to the changes in porosity, which is determined using Eq. (2). The specific moisture capacity Cm and storativity coefficient S are calculated using Eqs. (3) and (4), respectively (Narkuniene et al., 2022).
2.2 Soil Water Characteristic Curve Model
The volumetric moisture content in the compacted bentonite buffer blocks is defined by the soil water characteristic curve (SWCC). It can be expressed using the van Genuchten SWCC model (van Genuchten, 1980), where the effective saturation is represented by Eq. (5).
where θ is the volumetric moisture content in porous media, θs is the volumetric moisture content at saturation, θr is the residual volumetric moisture content, α is a coefficient related to the air entry value (1/MPa), n is a coefficient related to the slope of the inflection point, and m is a coefficient related to the residual moisture content. A relationship exists between m and n given by m = 1-1/n. These coefficients represent the unique characteristics of unsaturated soils and may vary depending on the soil type (Lu et al., 2010). In addition, pc represents the capillary pressure and is defined as the difference between the pore water pressure (pl) and air pressure (pa), as shown in Eq. (6).
Meanwhile, the Darcy model was employed to assess the flow characteristics of unsaturated bentonite buffer. The relative permeability coefficient (kr), expressed as a function of effective saturation, enables the simulation of changes in flow characteristics in response to variations in saturation.
where l is the power coefficient. In this study, it was set to 3 based on the data reported in previous numerical analyses of bentonite swelling behavior (Narkuniene et al., 2022; Narkuniene et al., 2021).
2.3 Swelling Model
When a bentonite buffer block becomes saturated, it exerts high swelling pressure on the disposal canister and surrounding rock owing to its high swelling capacity (Komine, 2004). Thus, evaluating the swelling behavior of bentonite buffers during the wetting process is crucial for determining the safety of disposal systems and designing engineering barriers (Lee et al., 2020; Rutqvist et al., 2014; Villar, 2004). In this study, the swelling behavior of bentonite was assessed by incorporating it into an elastic constitutive model based on the generalized Hooke's law (Narkuniene et al., 2022).
where σij represents the stress tensor, Ceijkl is the material stiffness tensor, εkl is the total strain tensor, and εklsw signifies the strain tensor owing to wetting-induced swelling.
Moreover, the swelling strain of the bentonite buffer is proportional to the change in effective saturation (Rutqvist et al., 2014).
where βsw represents the swelling coefficient for isotropic materials, ∆Se is the change in effective saturation, and δ is the Kronecker delta. The swelling coefficient (βsw) can vary depending on the type and density of bentonite, sample geometry, and experimental conditions. In addition, the swelling coefficient is typically related to the swelling index (Cs) determined from the void ratio-vertical stress relationship obtained from oedometer tests. In unconfined swelling experiments, when the volume changes owing to swelling occurrence, the change in the porosity of the sample can also vary. Such changes in porosity can be derived from the relationships with volumetric strain (Abed and Sołowski, 2017).
2.4 Finite Element Analysis
The buffer block is cylindrical and exists in a three-dimensional form. However, to simplify the analysis, a two-dimensional axisymmetric model considering half the cross-section of the block was applied. The analysis domain was set as a rectangular region with a radius of 25 mm and height of 10 mm, with symmetry boundary conditions applied to the left boundary (r = 0) of the domain. The analysis domain was discretized into multiple elements of uniform size, and 3240 rectangular elements were used, as shown in Fig. 1. The initial effective saturation of the bentonite buffer was assumed to be 45%, and the negative pore water pressure corresponding to the initial saturation was given as the initial pressure condition. At the bottom of the analysis domain, a constant pore pressure (1 MPa) was applied, and no flux conditions were imposed on the other boundaries. Different mechanical boundary conditions were applied based on the experimental conditions. For the confined test, roller conditions were applied to all the boundaries, whereas free conditions were applied to the top boundary for the unconfined test. The material properties applied in the analysis model are listed in Table 1. The analysis was performed over a duration of 240 h.
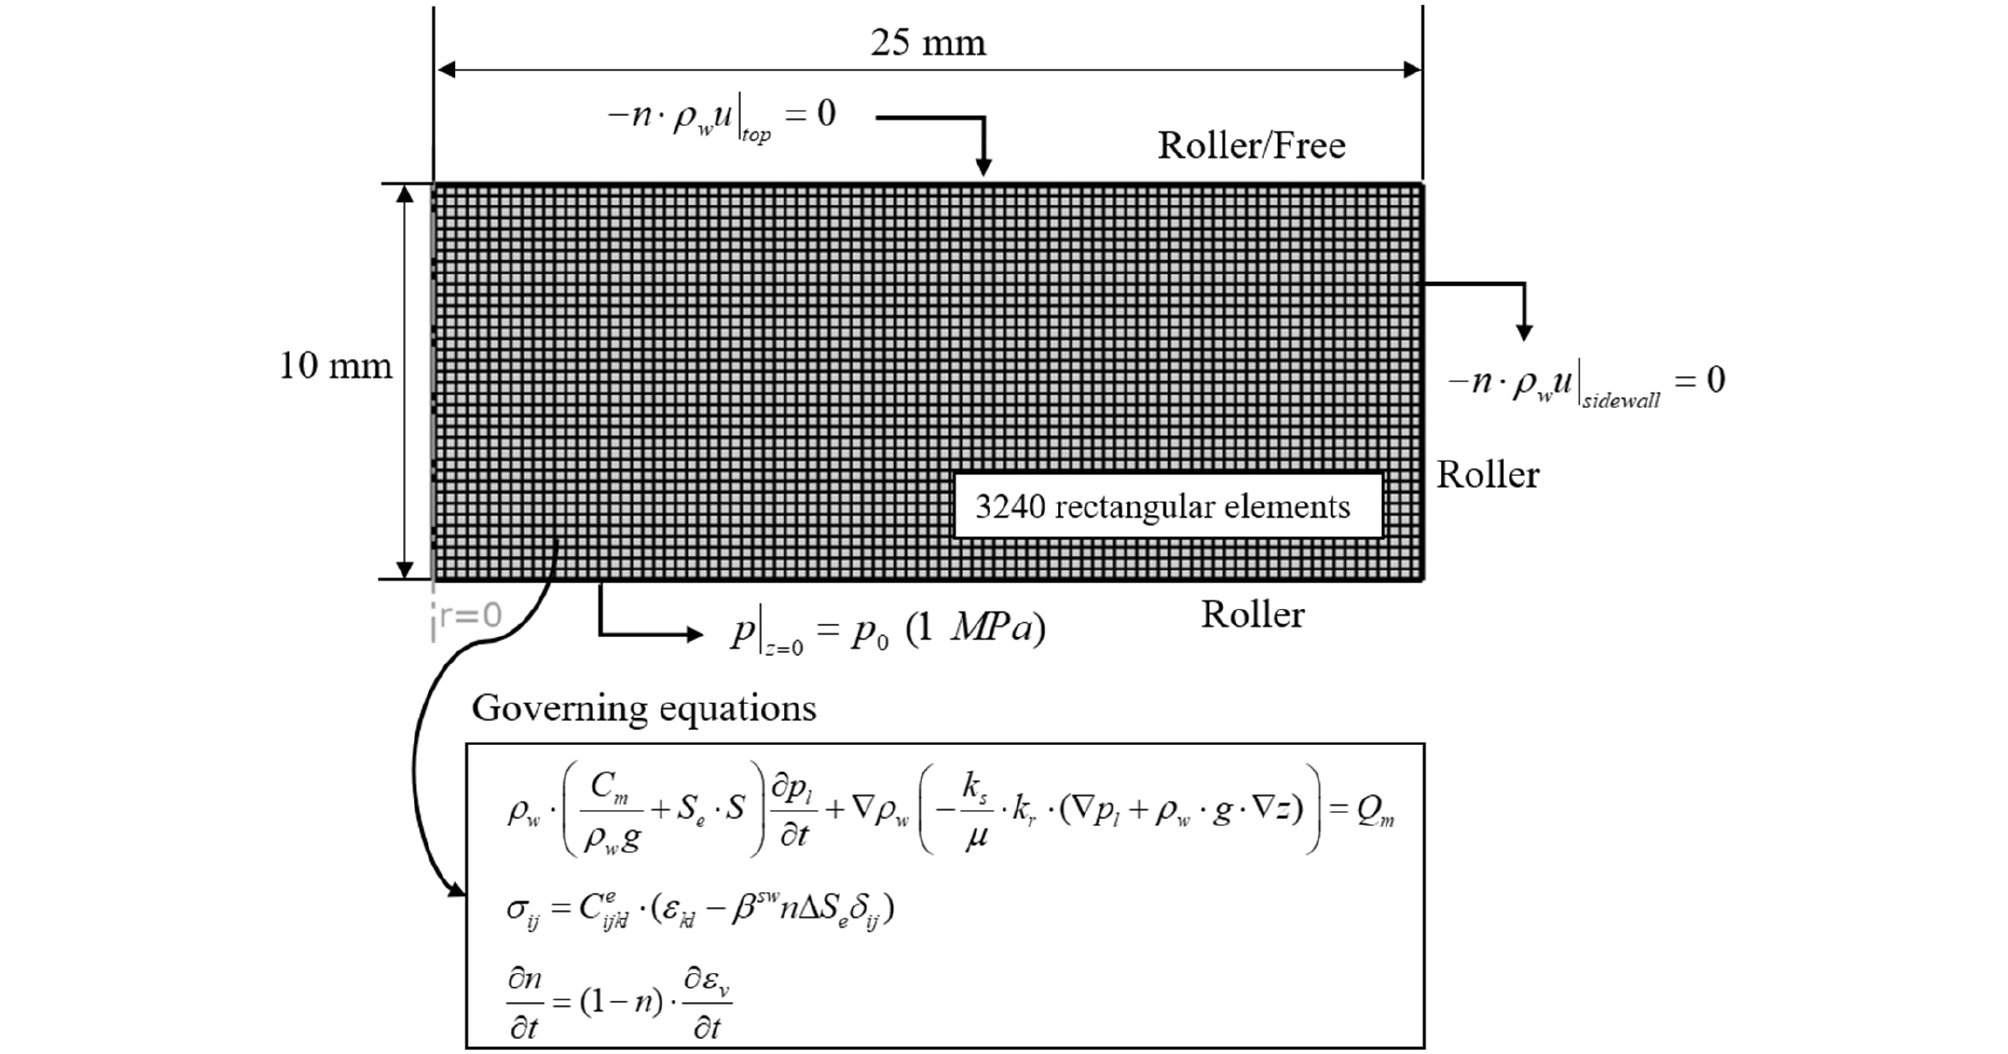
Table 1.
Material property used in the simulation model
| Parameter/Variable | Value | Unit | Reference |
| Specific gravity of buffer, Gs | 2.71 | - | Yoon et al., 2022 |
| Density of water, ρf | 1000 | kg/m3 | |
| Dry density of buffer, ρd | 1.59 | g/cm3 | Yoon et al., 2022 |
| Initial Young’s modulus of buffer, E0 | 13·106 | Pa | Narkuniene et al., 2022 |
| Young’s modulus of buffer, E | max(E/e2, E) | Pa | Narkuniene et al., 2022 |
| Swelling coefficient of buffer, βsw | 0.25 | Narkuniene et al., 2022 | |
| Bulk modulus of buffer, K | E/(3(1-υ)) | Pa | |
| Poisson’s ratio of buffer, υ | 0.3 | - | |
| Compressibility of buffer, χp | 1/K | 1/Pa | |
| Compressibility of water, χf | 4.4·10-10 | 1/Pa | |
| Volumetric water content of buffer at saturated condition, θs | 0.415 | - | Yoon et al., 2022 |
| van Genuchten’s SWCC parameter, α | 0.065 | 1/Pa | Yoon et al., 2022 |
| van Genuchten’s SWCC parameter, m | 1.527 | - | Yoon et al., 2022 |
| van Genuchten’s SWCC parameter, n | 0.345 | - | Yoon et al., 2022 |
2.5 Swelling Simulation According to Constraint Conditions
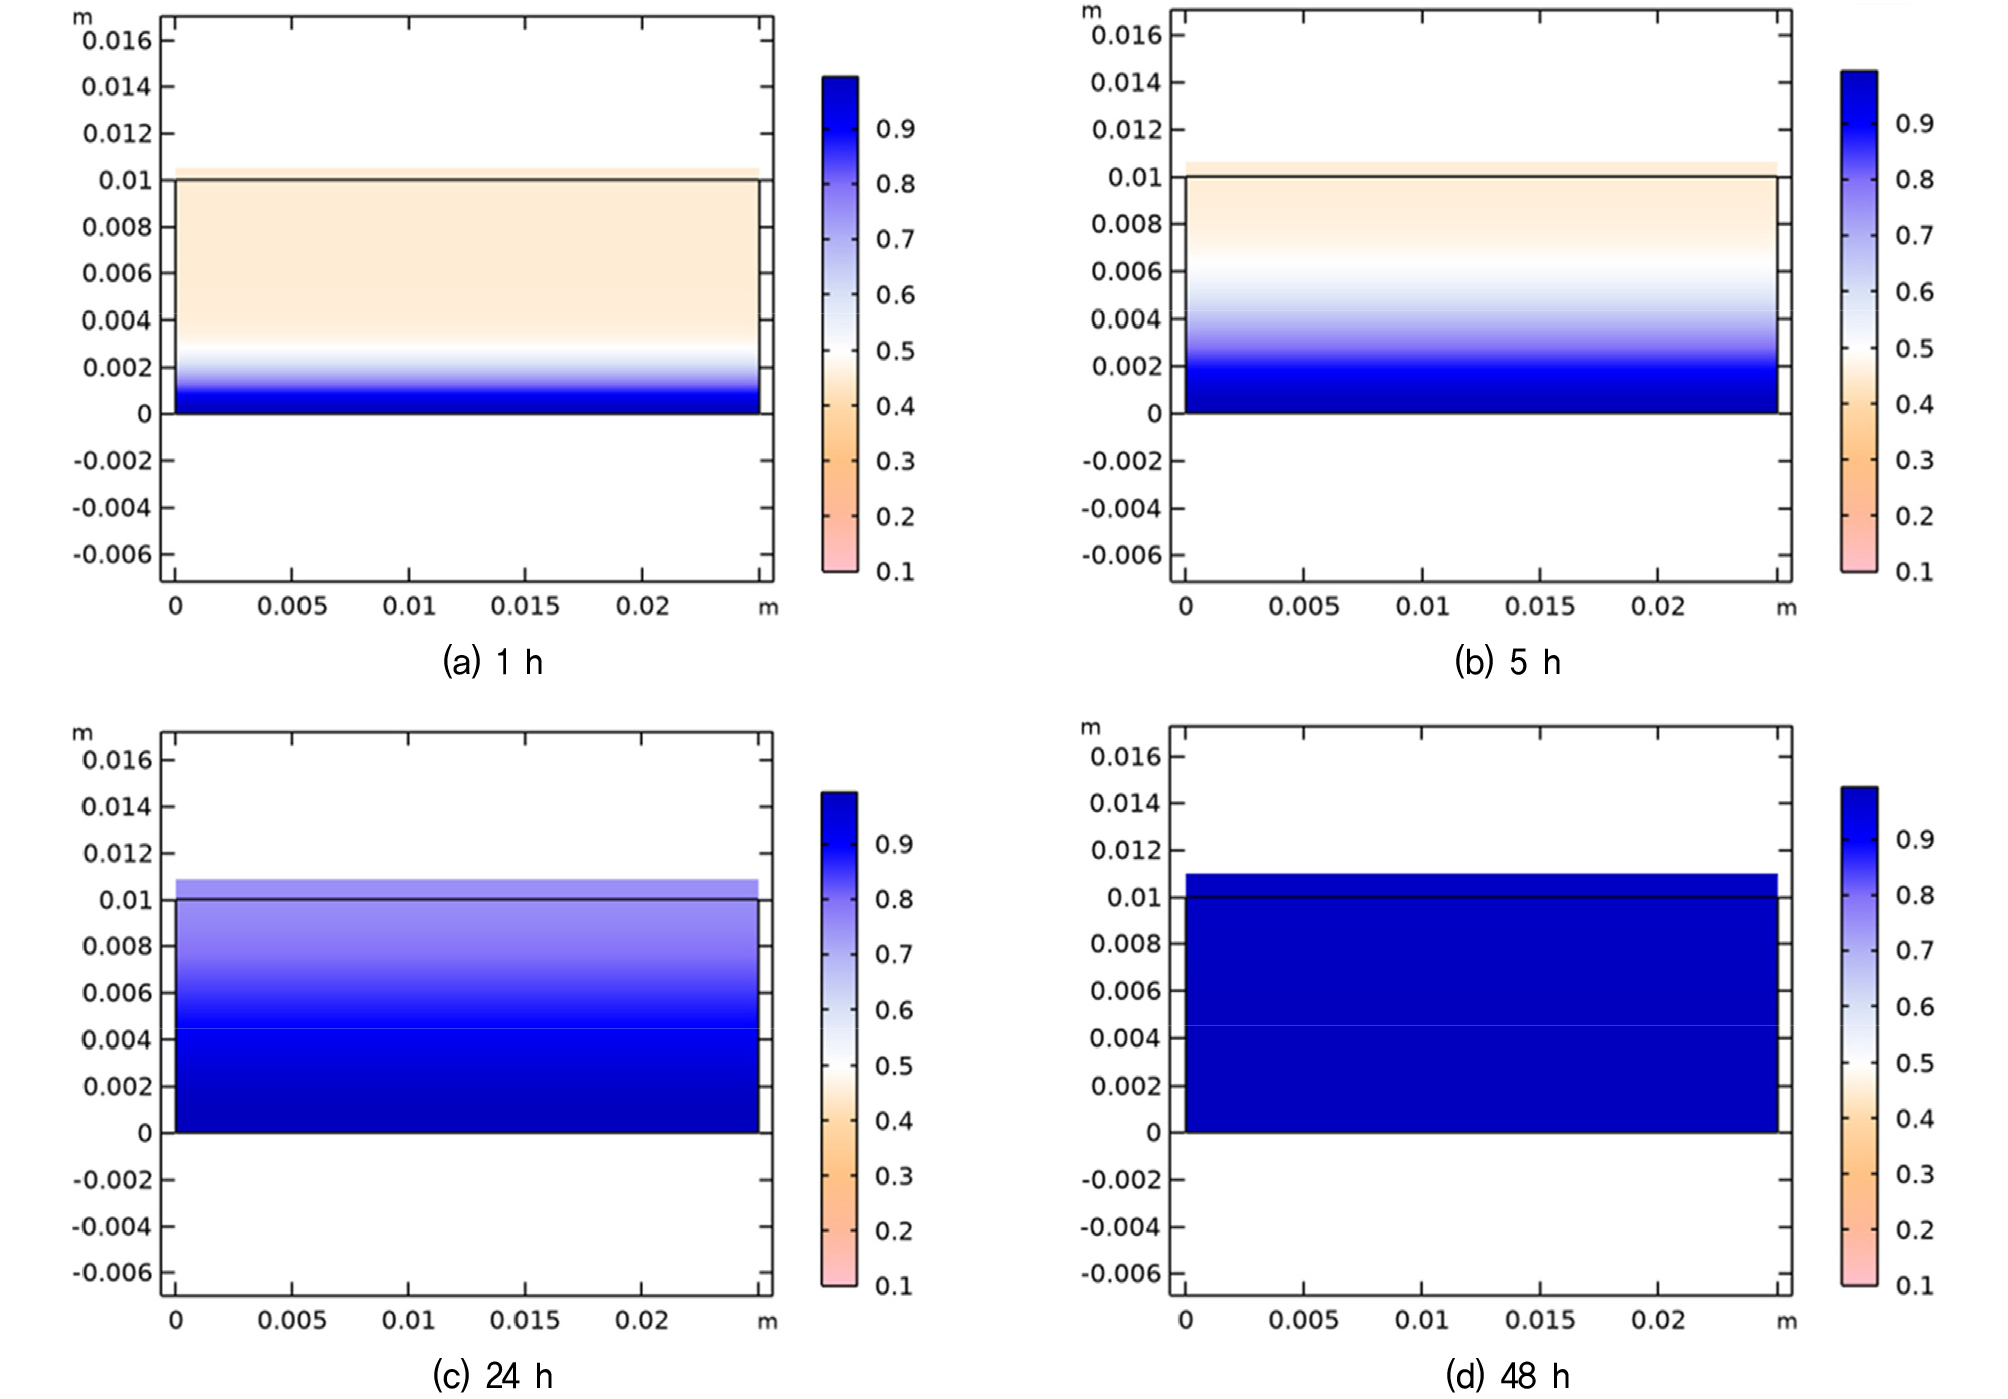
Figs. 2 and 3 depict the variations in effective saturation (Se) and volumetric moisture content (θ) within the bentonite buffer block during the wetting process under constraint conditions. There is a correlation between the effective saturation and volumetric moisture content, as described in Eq. (5), and the wetting state of the buffer block can be evaluated using the effective saturation or volumetric moisture content. After 1 h, the sample became saturated at approximately 1 mm from the bottom, and after 5 h, it reached approximately 2.5 mm. After 48 h, the entire sample reached 100% effective saturation.
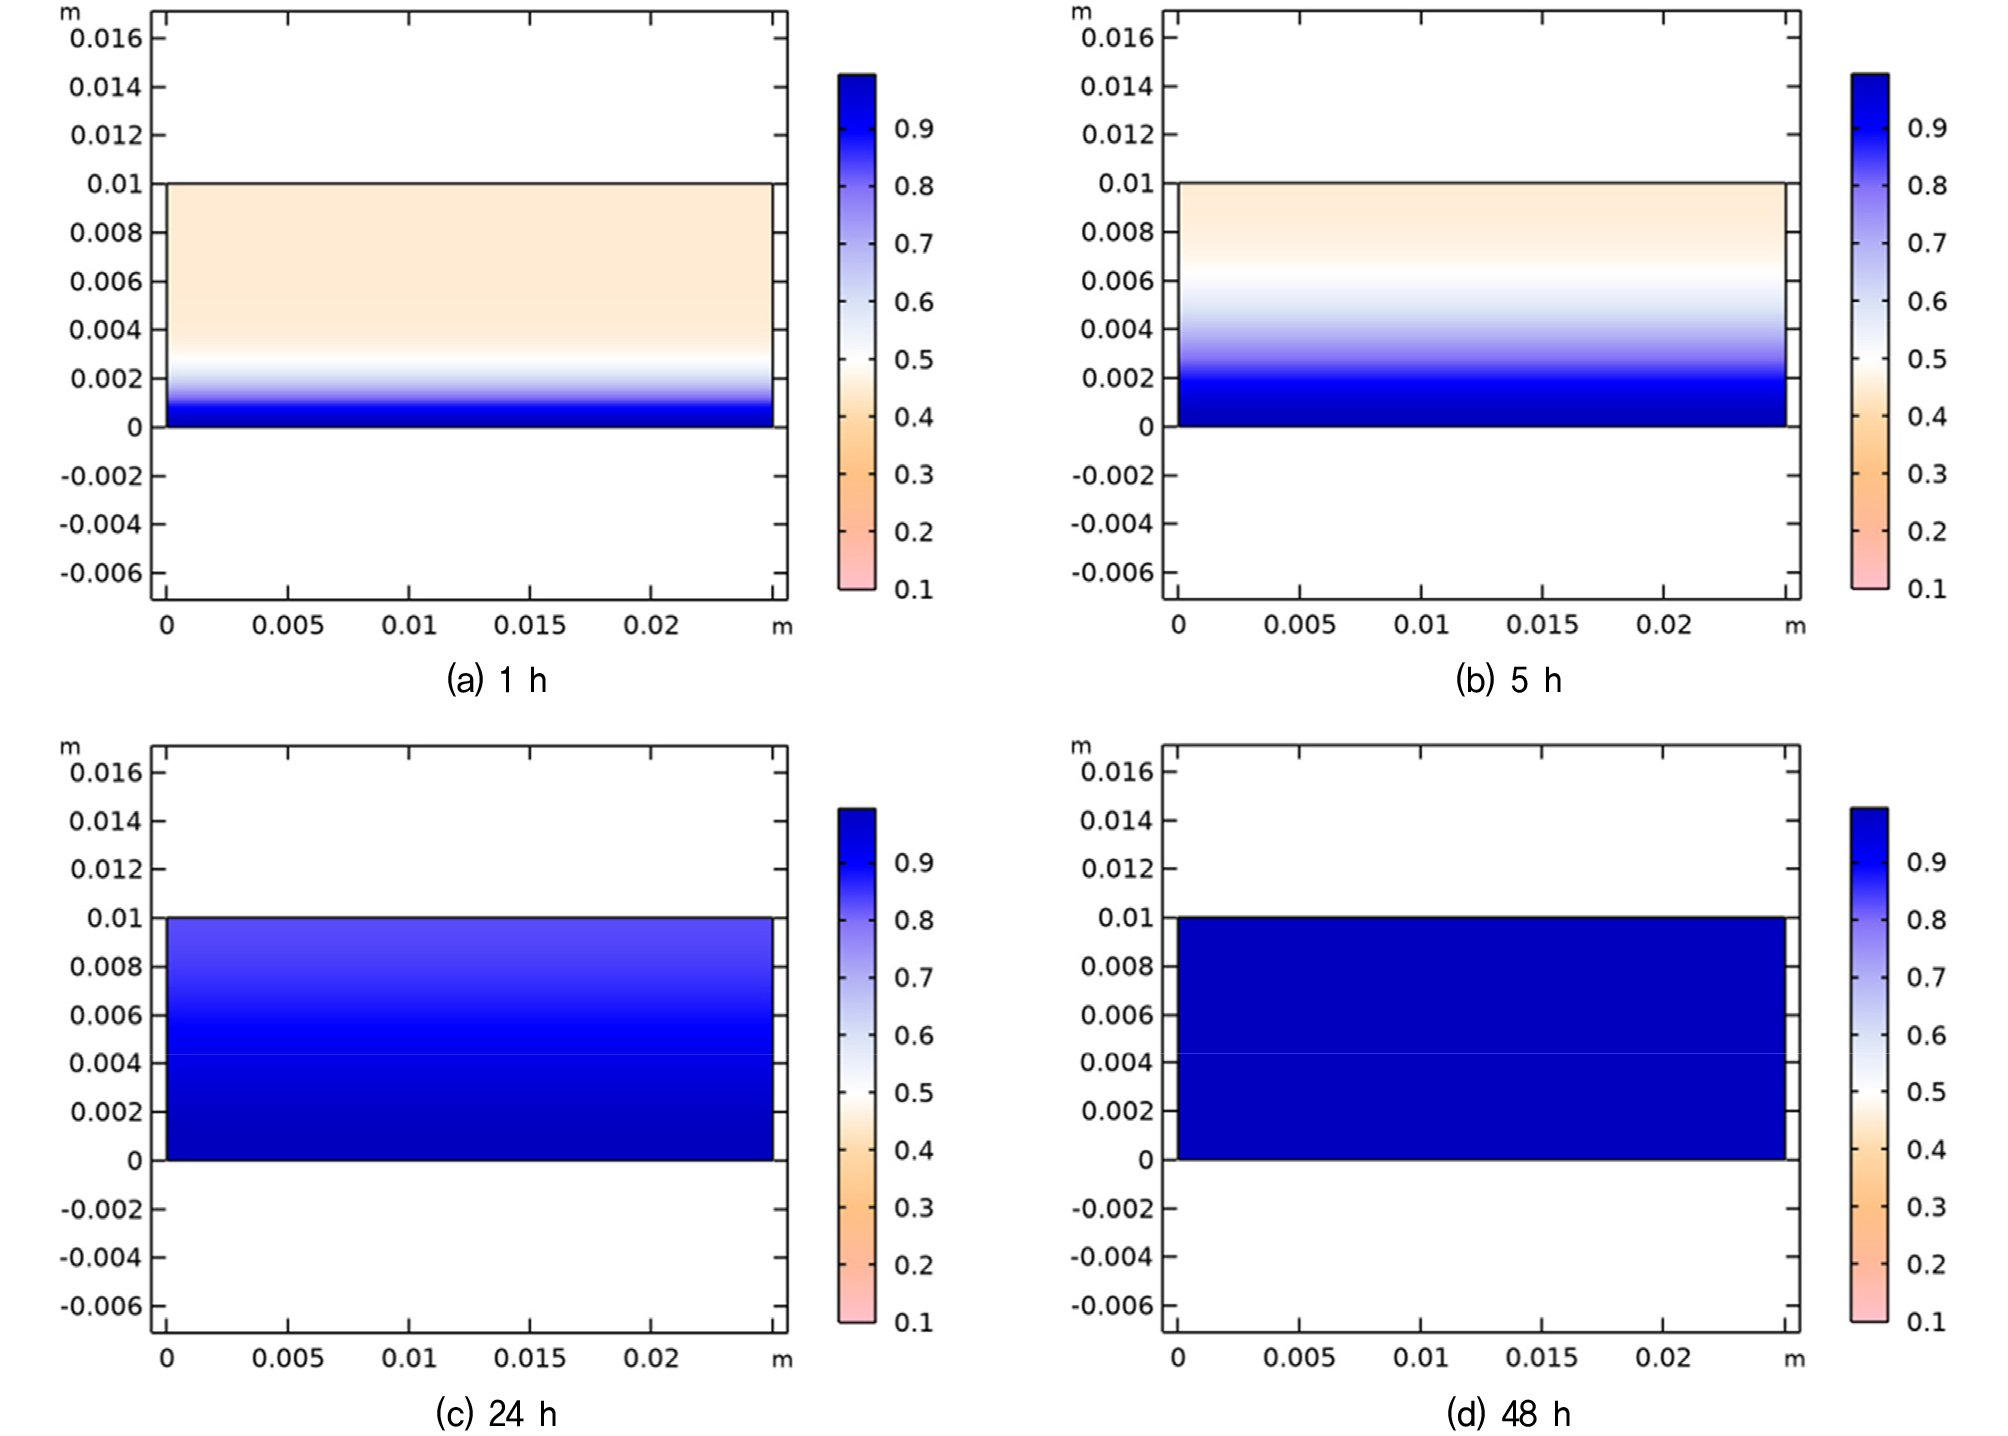
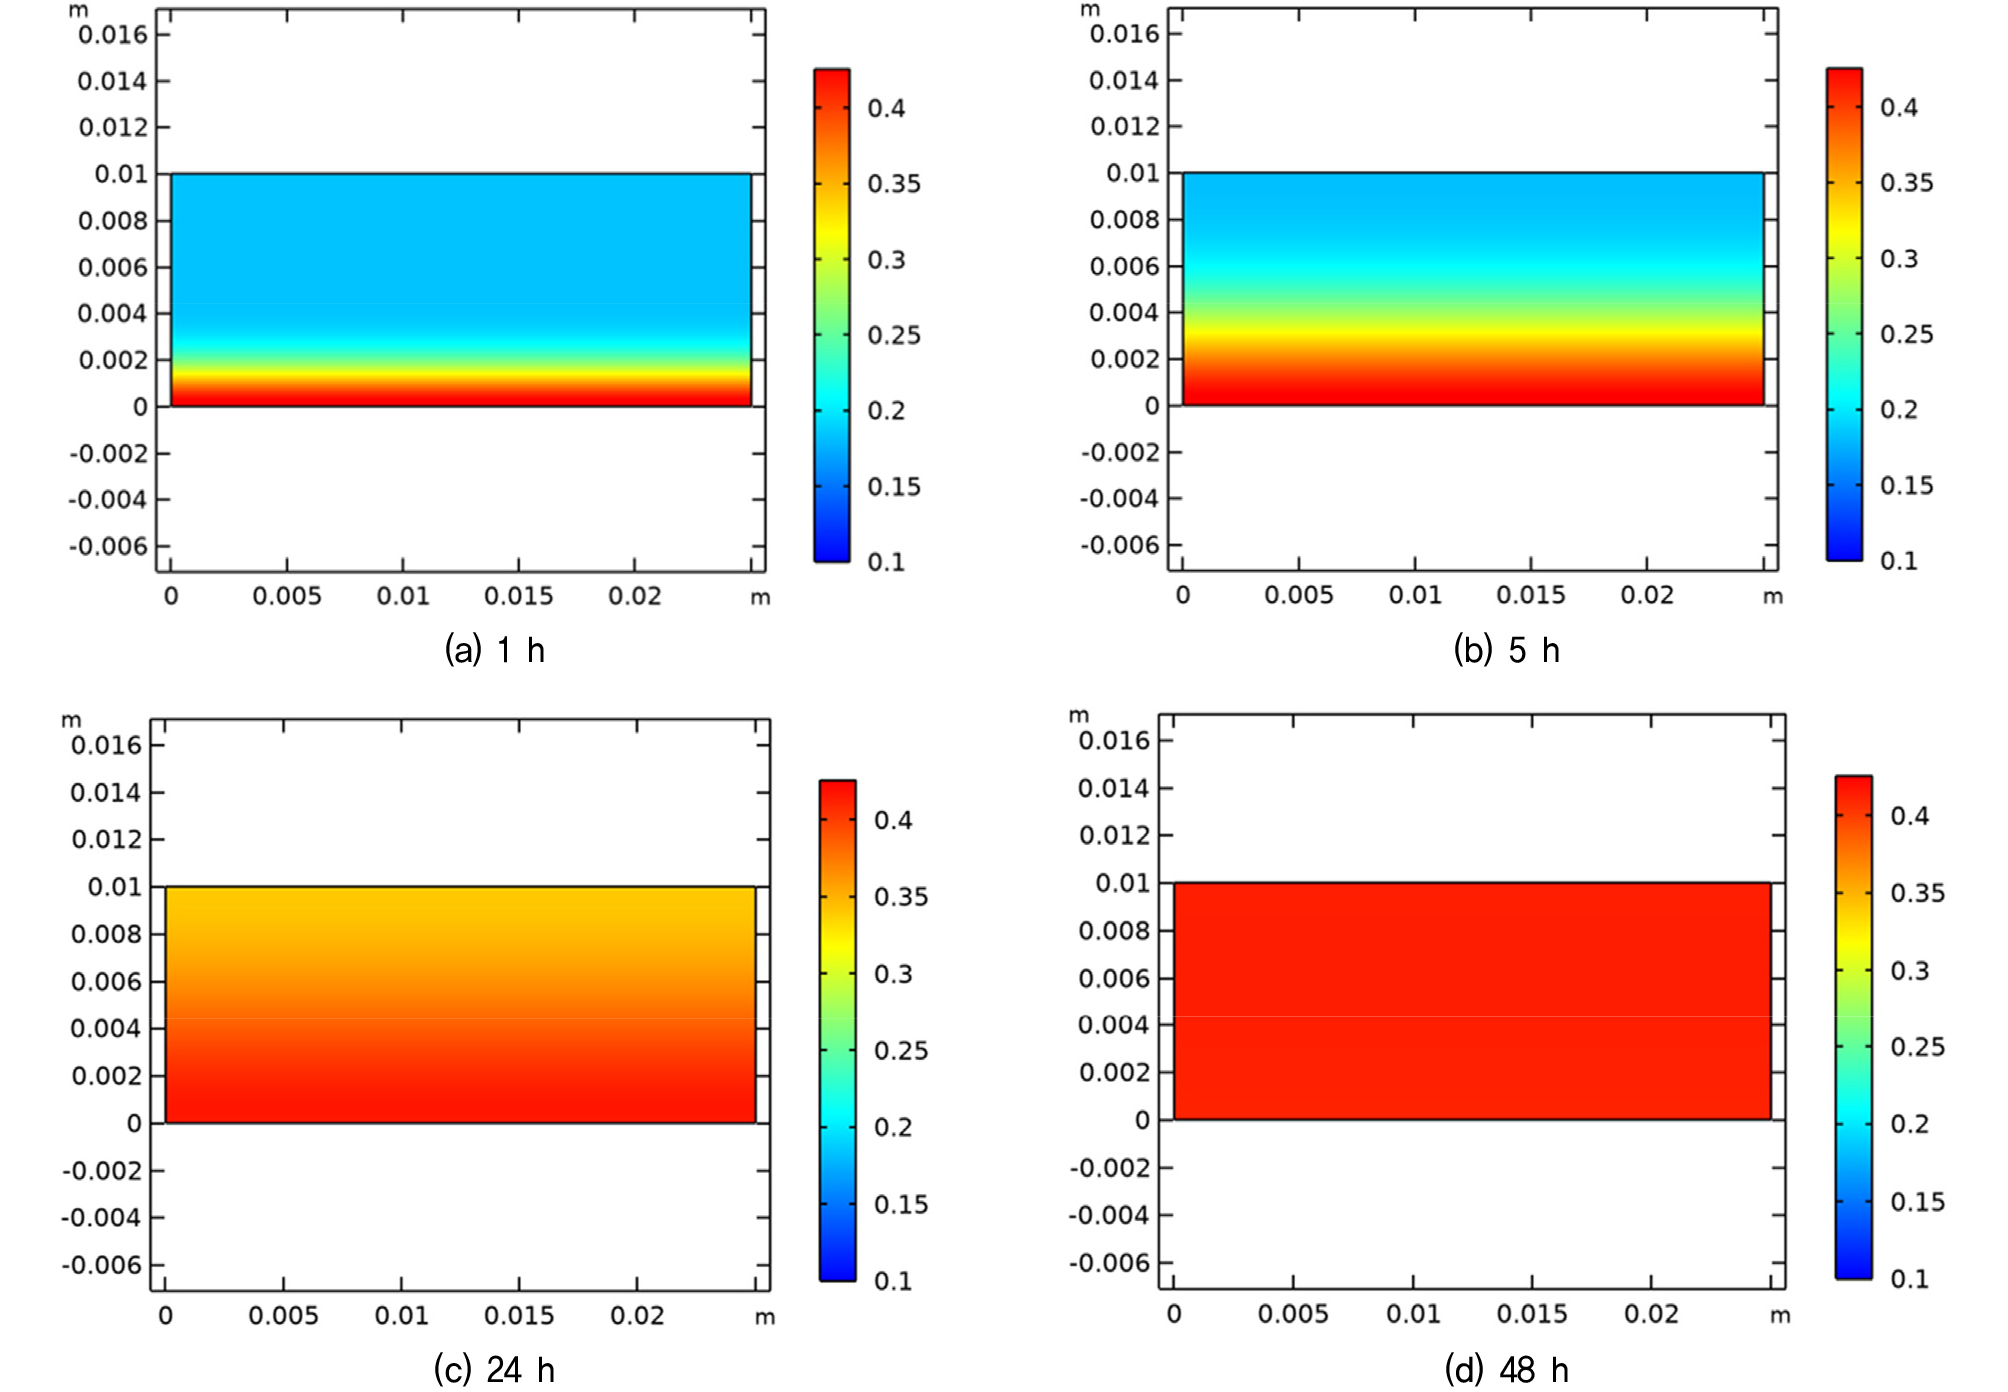
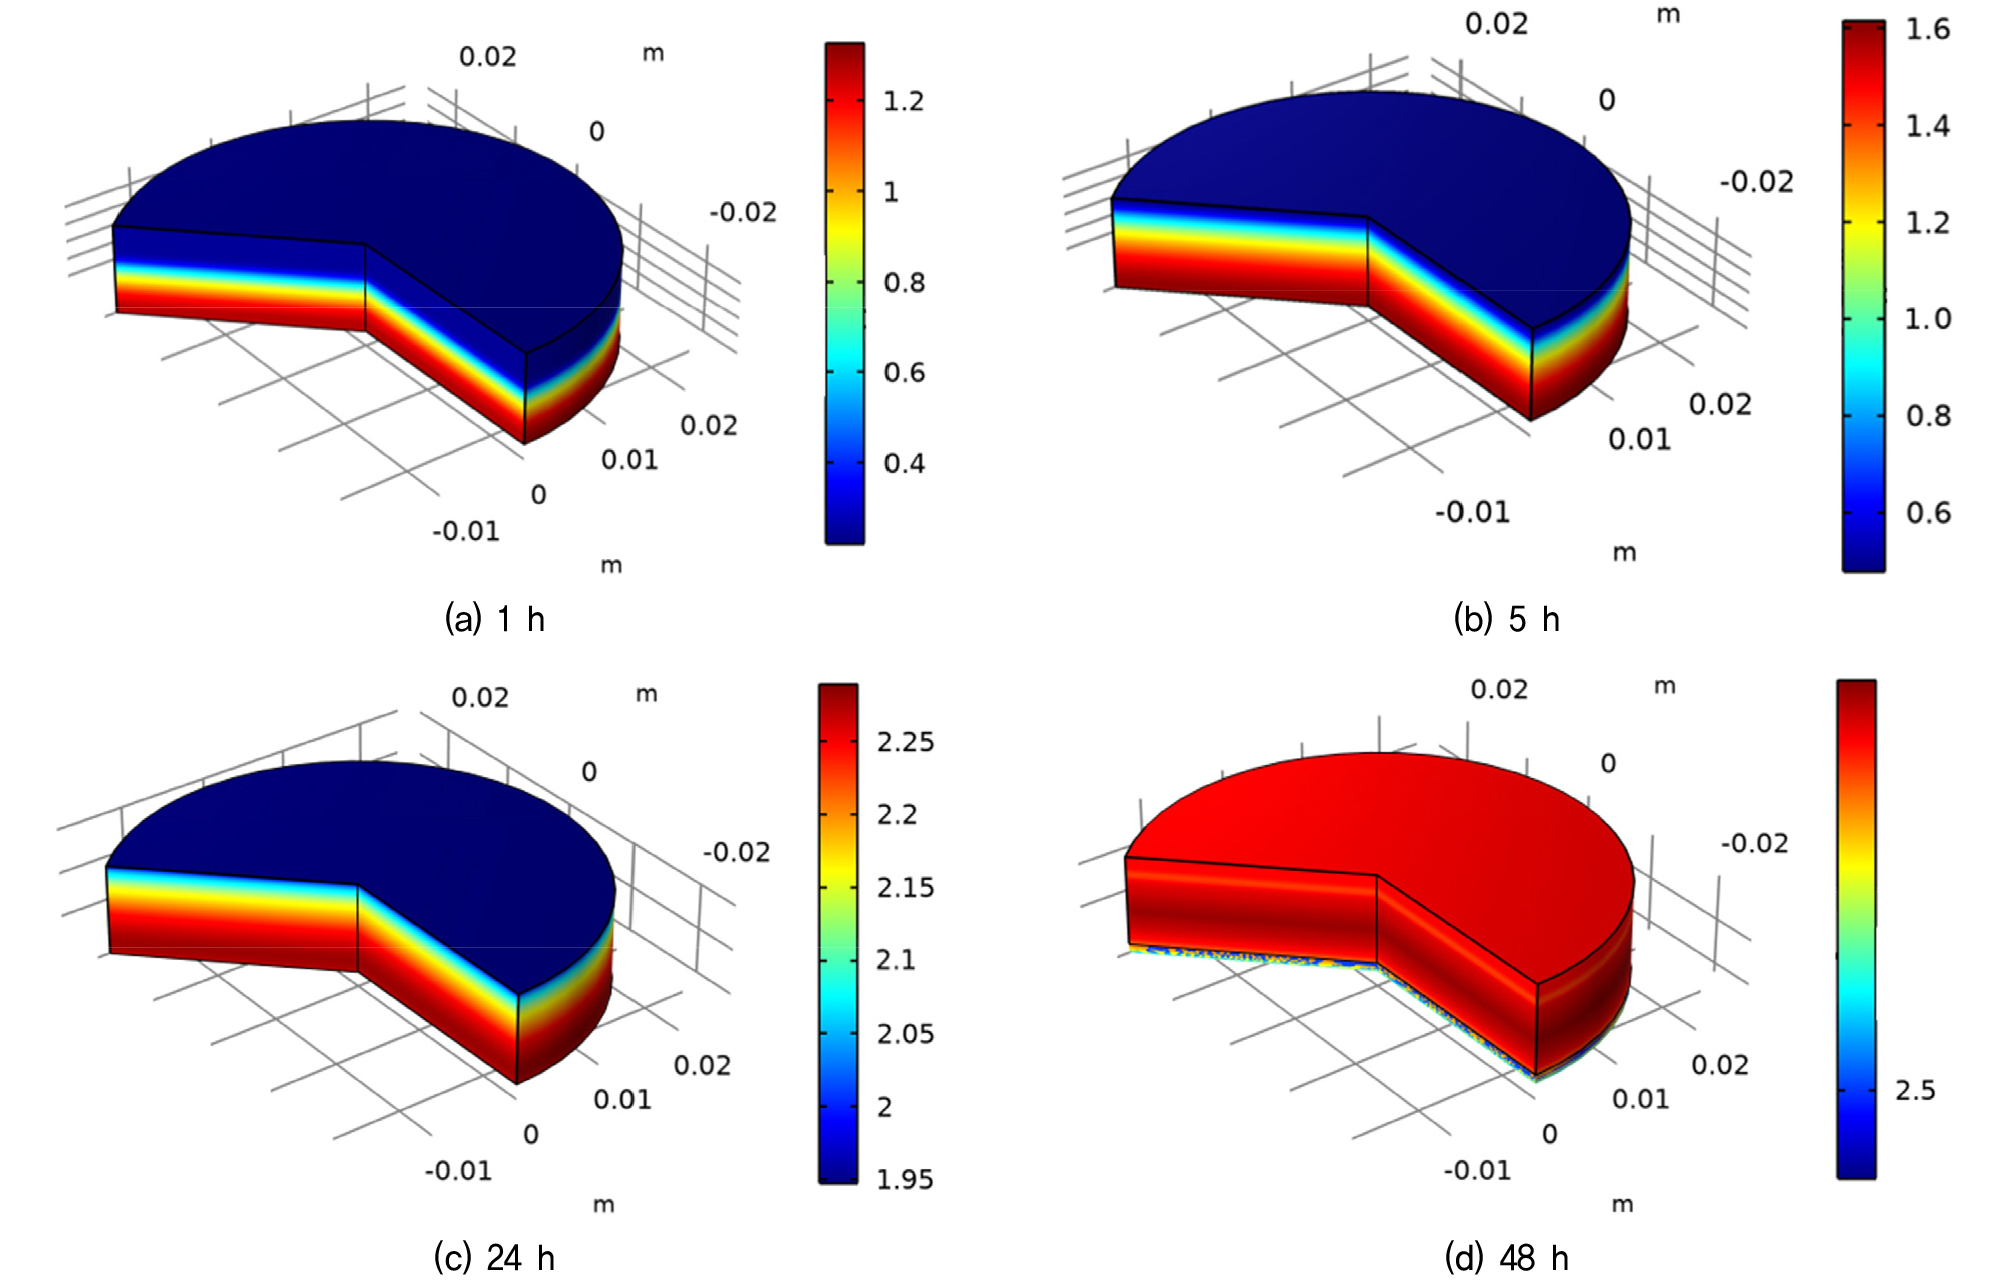
Fig. 4 illustrates the changes in the swelling pressure within the buffer during the wetting process under constraint conditions. As the saturation progresses, swelling pressure forms from the bottom to the upper regions of the sample, and when the sample is almost fully saturated, the magnitude of the swelling pressure converges to a constant value. In contrast, under unconfined conditions, swelling pressure does not form during the wetting process; instead, swelling displacement occurs. Fig. 5 shows the swelling deformation within the bentonite buffer and variations in the effective saturation under unconfined conditions. The swelling displacement increases nonlinearly with time. Once complete saturation is reached, the displacement no longer increases and stabilizes at a constant value.
2.6 Model Validation
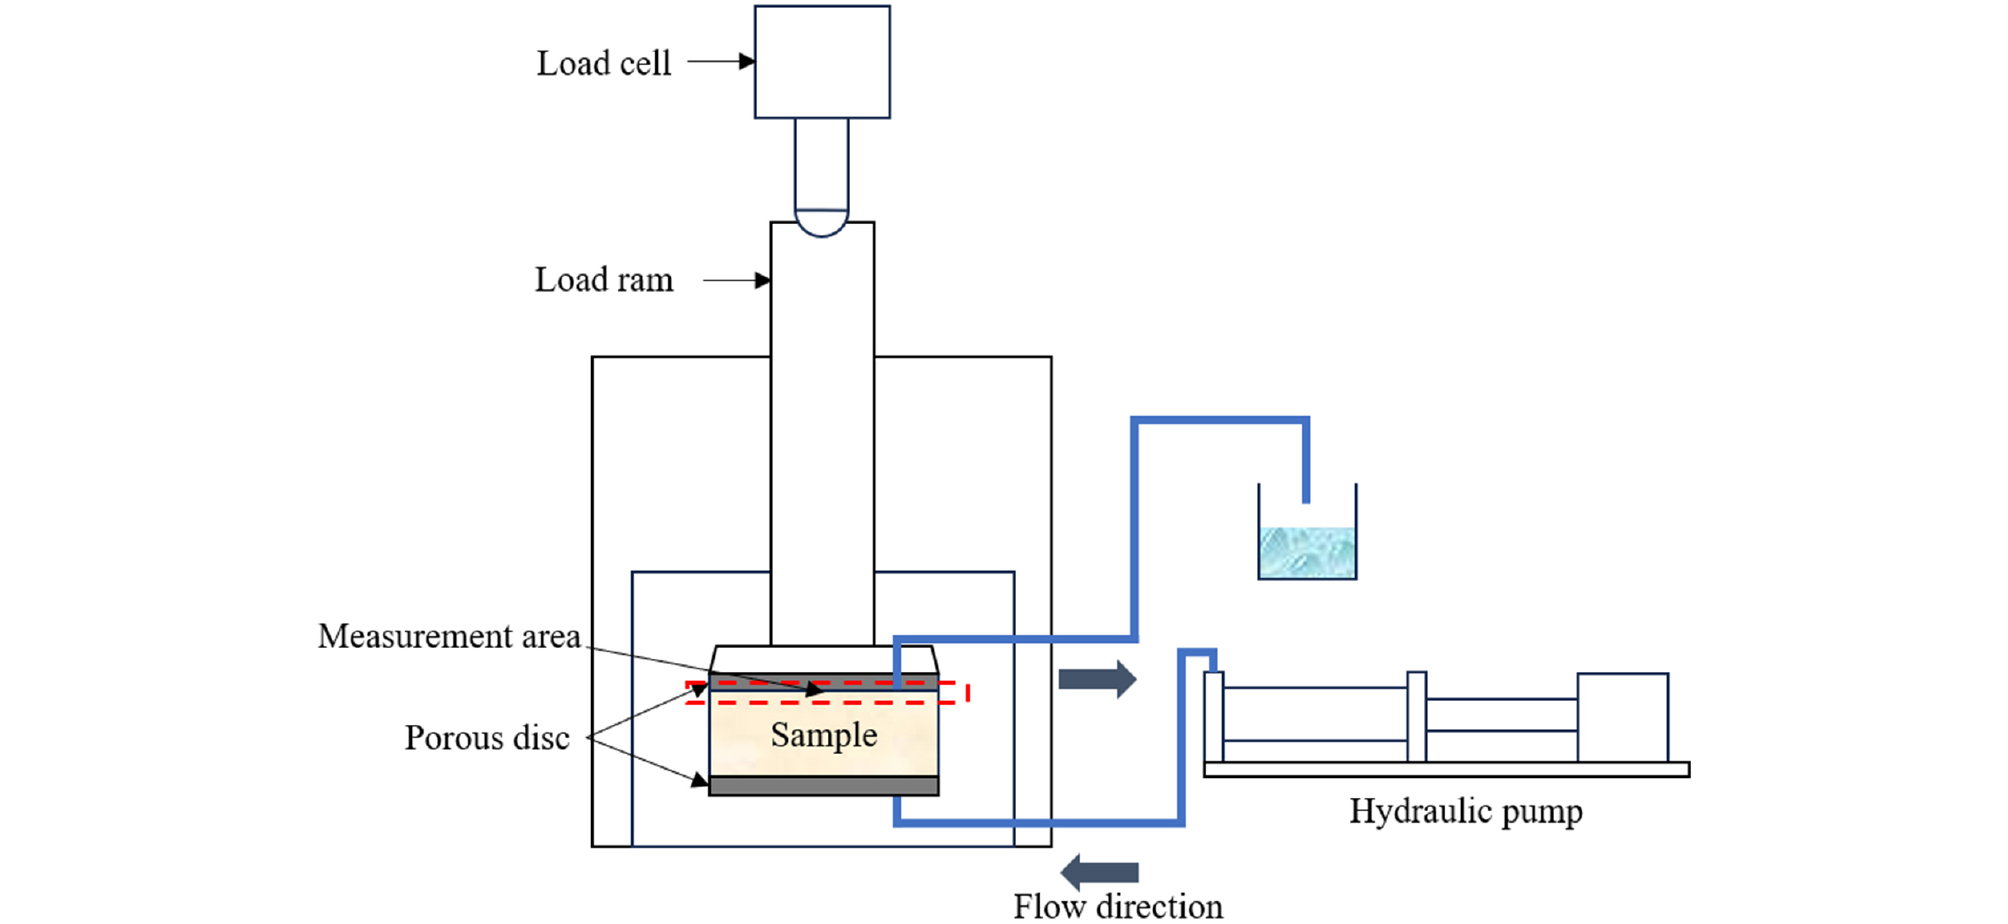
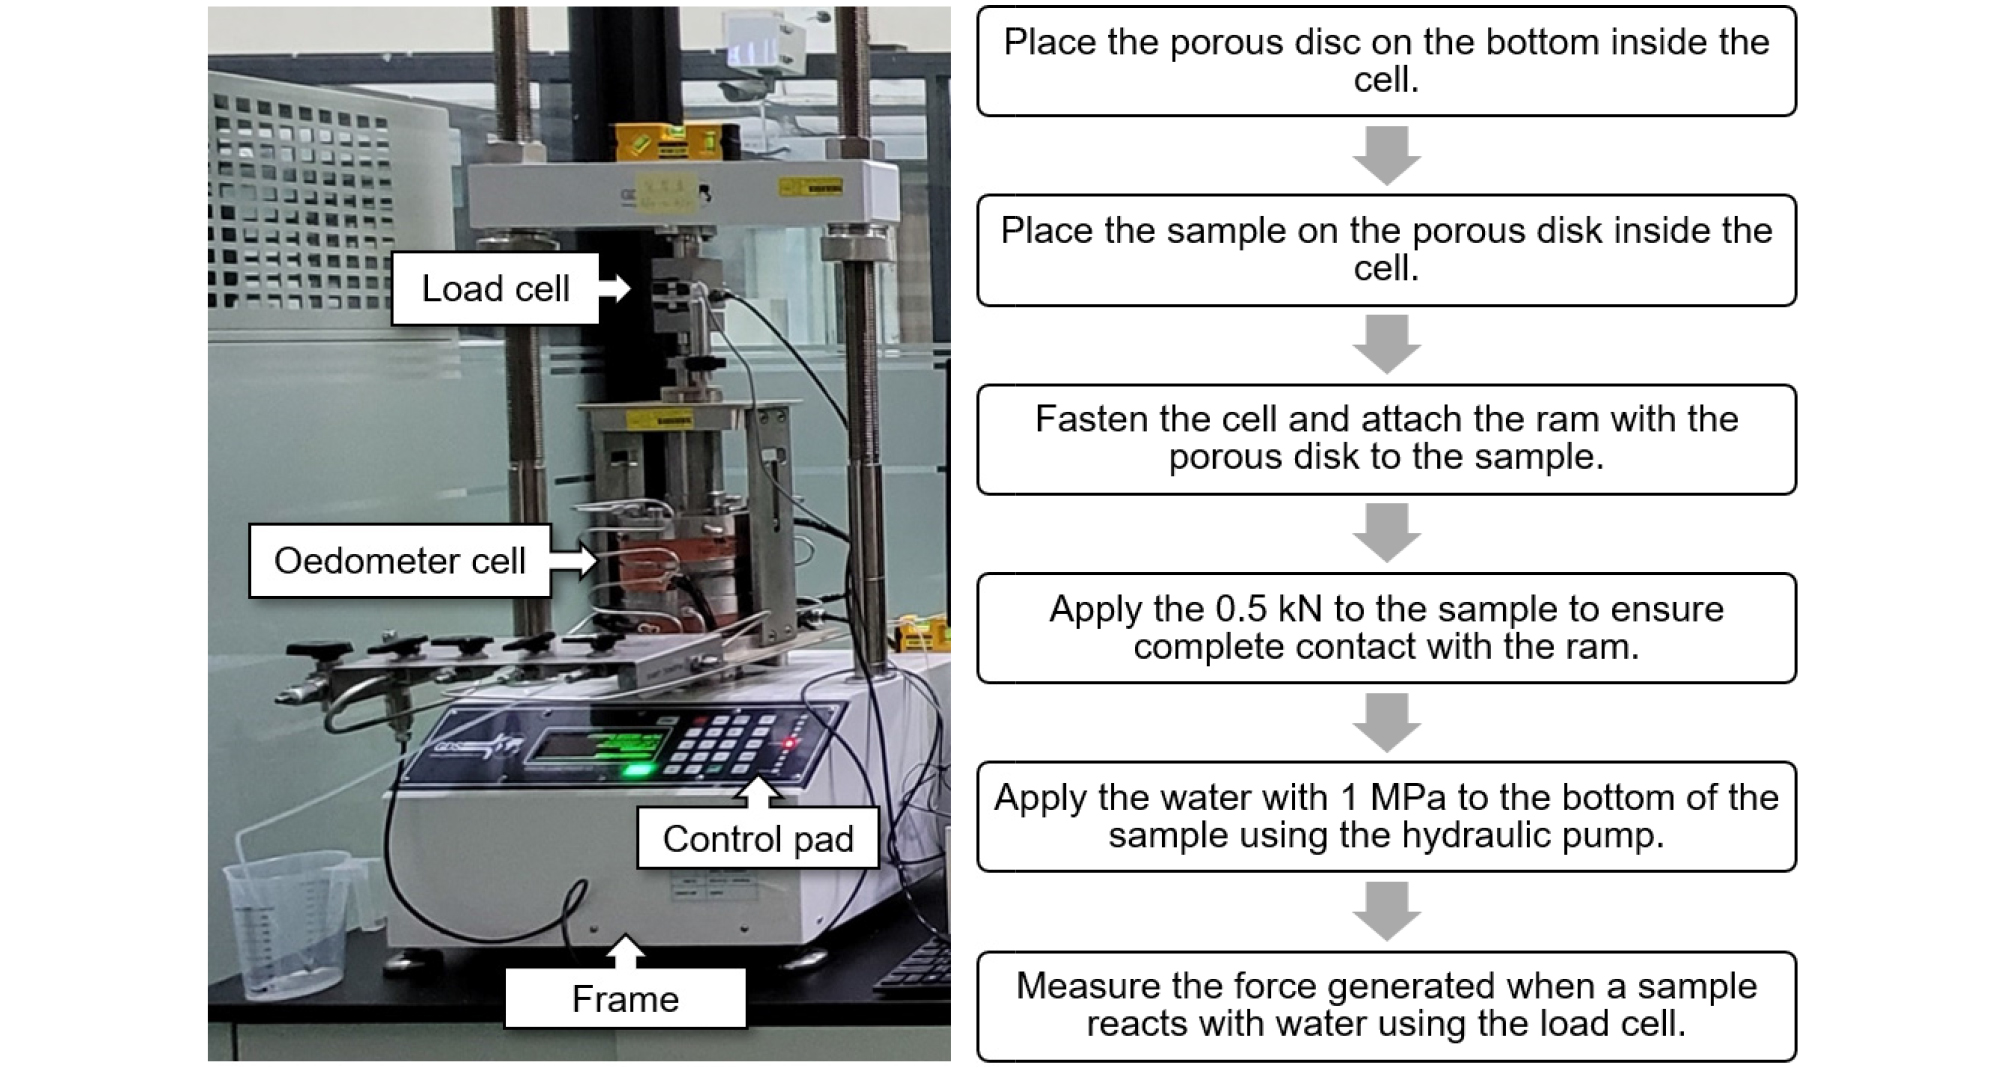
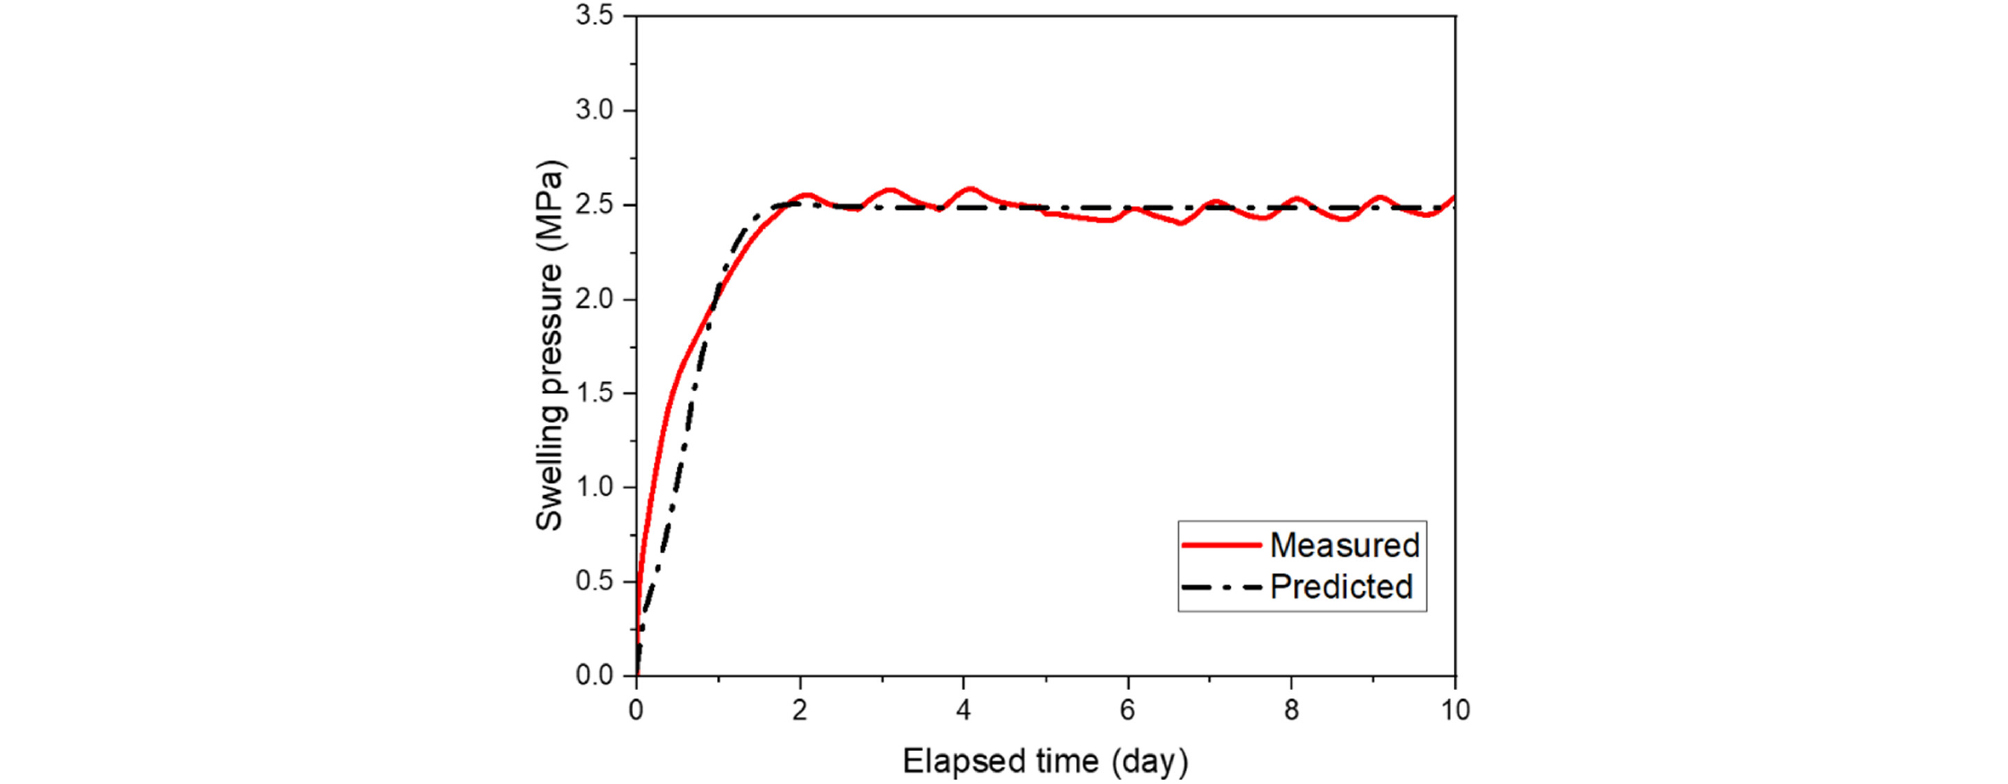
To validate the reliability of the prediction model, we compared the simulation results with the swelling pressure test results. The validation test was conducted by us on a sample of a bentonite block made of KJ-II, with an initial dry density of 1.59 g/cm3, an initial water content of 12%, a diameter of 5 cm, and a thickness of 1 cm. The sample was placed in the oedometer cell to measure swelling pressure (Fig. 6). The ram was in contact with the sample, and the opposite side of the ram was in contact with the piston attached to the load cell, as shown in Fig. 6. Therefore, the force exerted when the sample expands was transmitted to the load cell through the ram and piston. The swelling pressure was measured under constraint-volume conditions because it is essential to measure the force when the sample expands. At the beginning of the test, a force of approximately 0.5 kN was applied to the sample to ensure complete contact with the ram. Subsequently, water was continuously supplied by applying a pore pressure of 1 MPa at the bottom boundary of the bentonite block using the hydraulic pump. Finally, the swelling pressure generated as the sample reacts with water during the saturation process over time was measured using a load cell. The overall test progress is shown in Fig. 7. Fig. 8 compares the measured swelling pressure with the swelling pressure simulated from the numerical analysis model. The numerical simulation results reasonably predict the experimental results. Therefore, future research can utilize the proposed analysis model in various applications related to bentonite swelling.
3. Analysis of Swelling behavior according to Experimental Conditions
3.1 Swelling Pressure according to Geometrical Shapes of Buffer Blocks
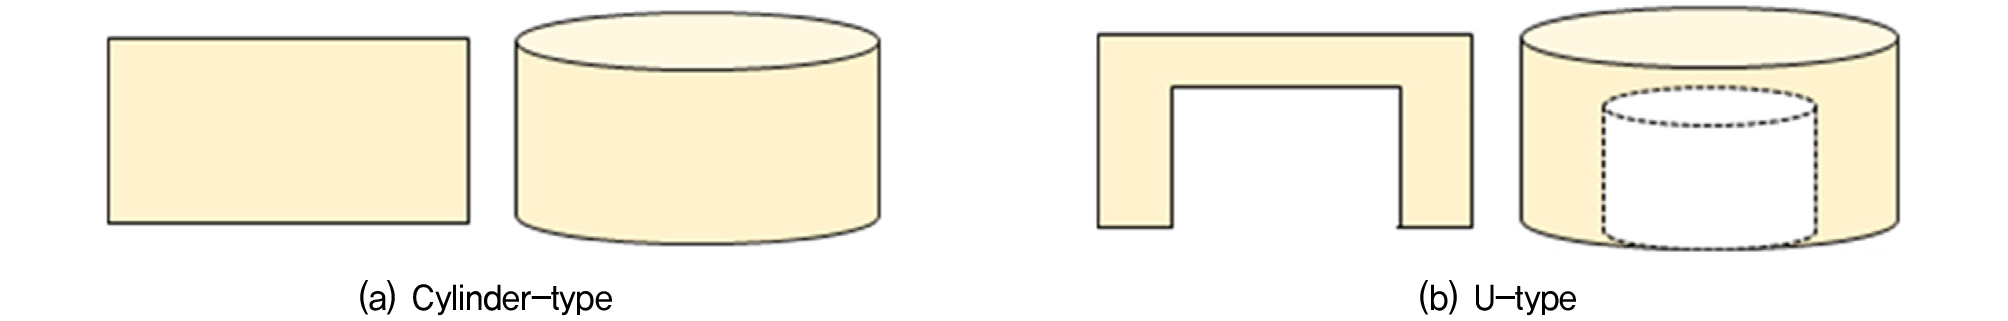
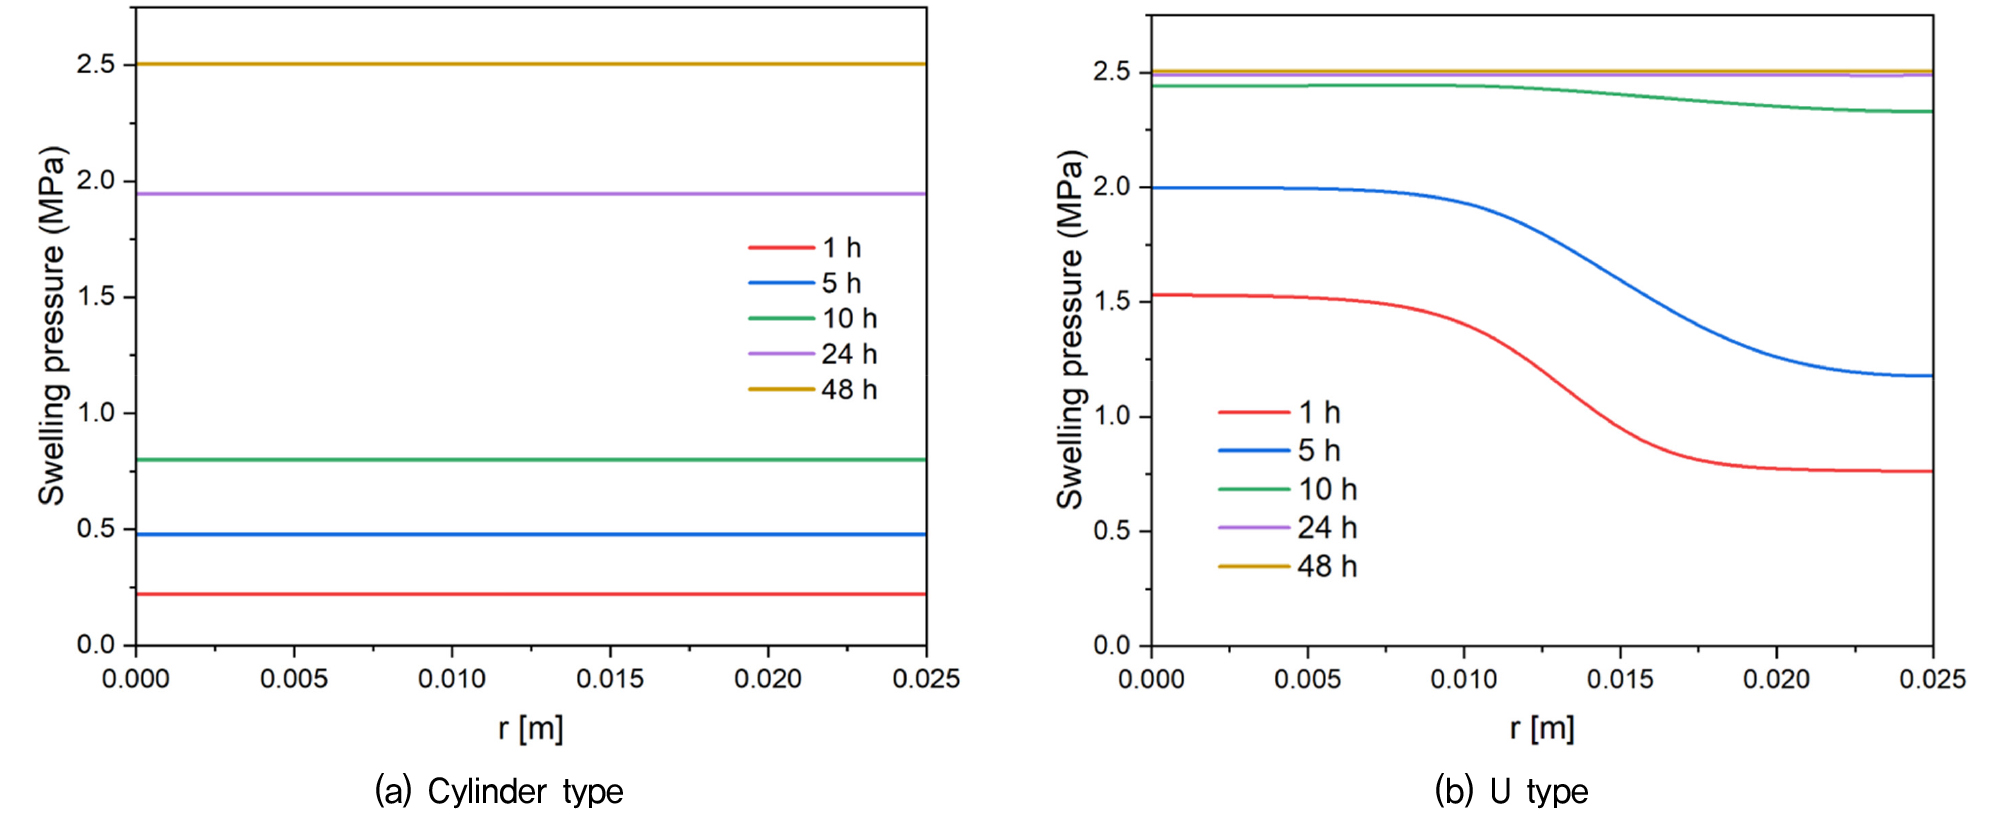
In this study, we utilized the numerical analysis model developed and validated in Section 2 to calculate and compare the swelling pressures for various geometrical shapes of buffer blocks, such as cylindrical and U-shaped, as shown in Fig. 9. U-shaped buffer blocks are considered because they represent a more realistic field condition, as actual bentonite buffer materials are often inserted in a U-shape between the disposal canister and disposal hole. When simulating the swelling behavior of the U-shaped block, a total of 5670 square elements were used, and the initial and boundary conditions for pressure were given the same as those in the cylindrical experiment. Fig. 10 depicts the change in swelling pressure of the bentonite buffer block over time, based on the distance from the top center of the buffer block. Although the final swelling pressures were the same for both shapes, the U-shaped block exhibited a significantly faster increase in swelling pressure. Furthermore, in the U-shaped block, the central region initially experiences a more rapid pressure increase than the outer region. However, this difference gradually diminishes over time, reaching the same swelling pressure. This is because the height of the block at the center is relatively narrow, causing a rapid increase in swelling pressure, but as time passes, the swelling pressure is distributed throughout the sample due to constraints at the top of the sample. In addition, as shown in Fig. 11, the U-shaped sample exhibits a localized high swelling pressure near the inner corners of the disposal canister, which may be a critical area for a detailed safety assessment of the bentonite swelling pressure on the disposal canister in future evaluations. It is important to note that the analysis results presented here consider only a constant water pressure at the bottom, consistent with the boundary conditions discussed in Section 2.4. For a more accurate simulation of the real disposal environment, future studies should consider various drainage conditions.

3.2 Swelling Pressure according to Dry Density of Buffer Material
In this section, we used a numerical analysis model to calculate the swelling pressure of the bentonite buffer blocks based on their dry densities, as shown in Fig. 12. The shape of the bentonite buffer material considered was cylindrical, and the swelling pressure at the top of the specimen was predicted from the constraint test conditions. Bentonite exhibits different soil water characteristics depending on the initial dry density of the buffer blocks. Table 2 presents the initial volumetric moisture content, and van Genuchten fitting curve changes based on the dry density of the buffer blocks, as determined through the SWCC experiments. In this study, we numerically examined the variation in the swelling pressure according to the dry density using the parameters listed in Table 2.
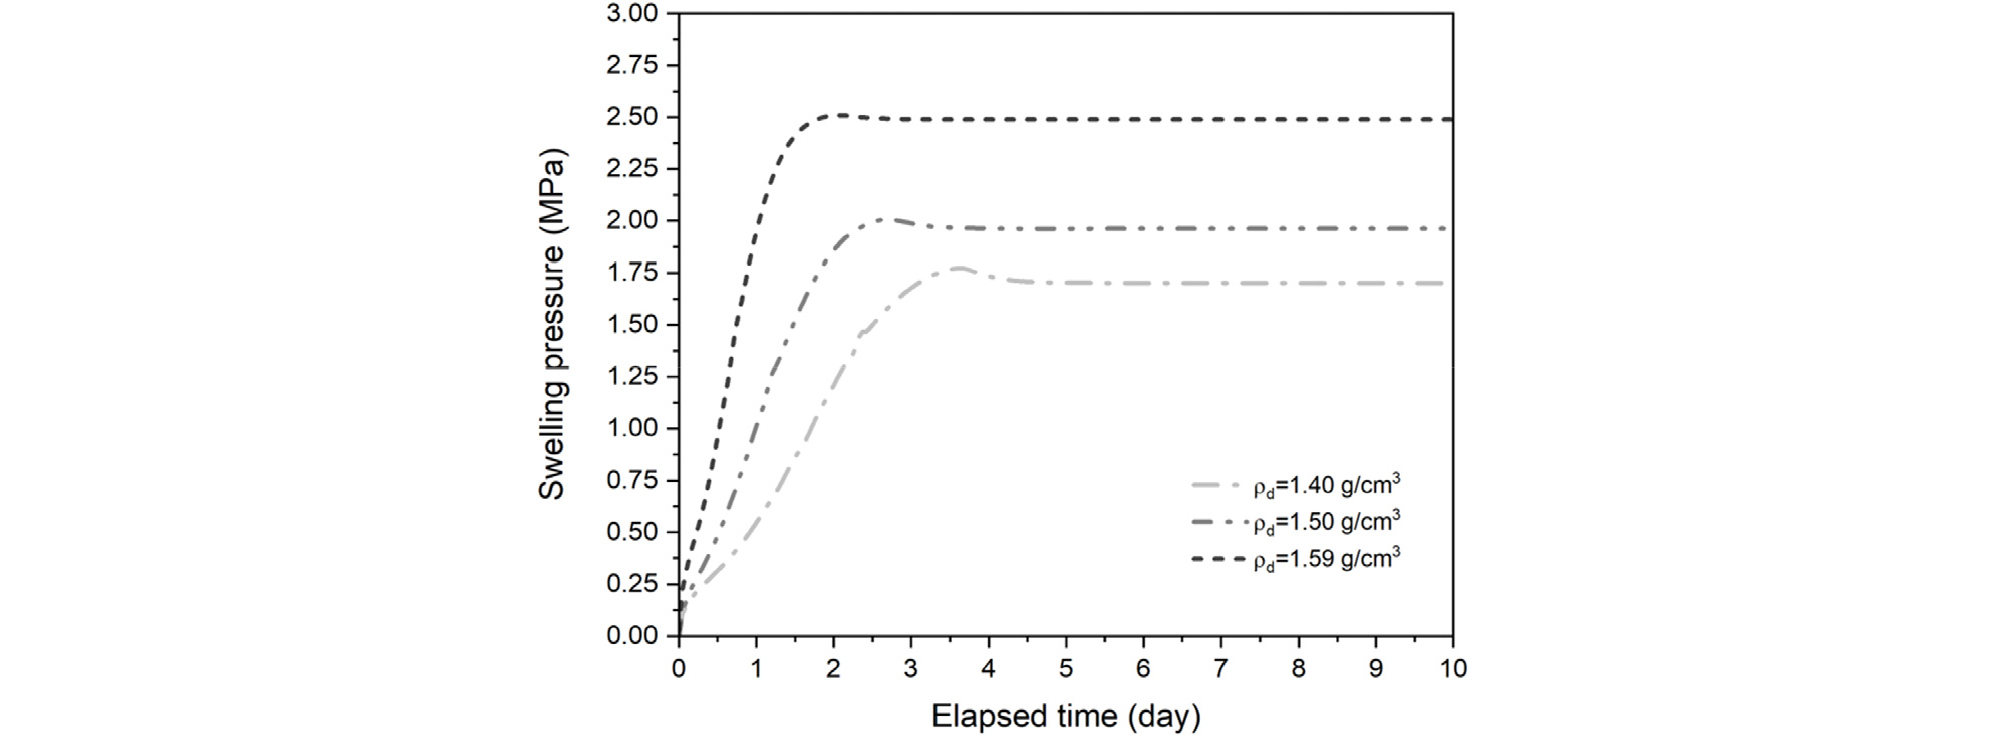
Table 2.
Saturated water contents and estimated van Genuchten parameters of KJ-II bentonite (Yoon et al., 2022)
| Dry density, ρd (g/cm3) | θs | α (1/MPa) | n |
| 1.40 | 0.481 | 0.2131 | 1.337 |
| 1.50 | 0.454 | 0.1235 | 1.369 |
| 1.59 | 0.415 | 0.0650 | 1.527 |
As shown in Fig. 12, the higher the dry density of the bentonite buffer material, the faster the rate of swelling pressure increases, and the final swelling pressure also increases. When bentonite interacts with water, the water infiltrates the base layers within the bentonite, increasing the distance between the montmorillonite layers and causing swelling (Yong, 1999). Subsequently, water is drawn into the bentonite because of the osmotic potential difference between the groundwater and bentonite porewater. Under constrained conditions, compacted bentonite cannot change its volume but generates swelling pressure in the surrounding structure. The trends observed in Fig. 13 closely resemble those reported in previous studies on dry density-dependent swelling pressure experiments on compacted bentonite (Schanz and Al-Badran, 2014; Lu et al., 2022; Bag and Jadda, 2021).
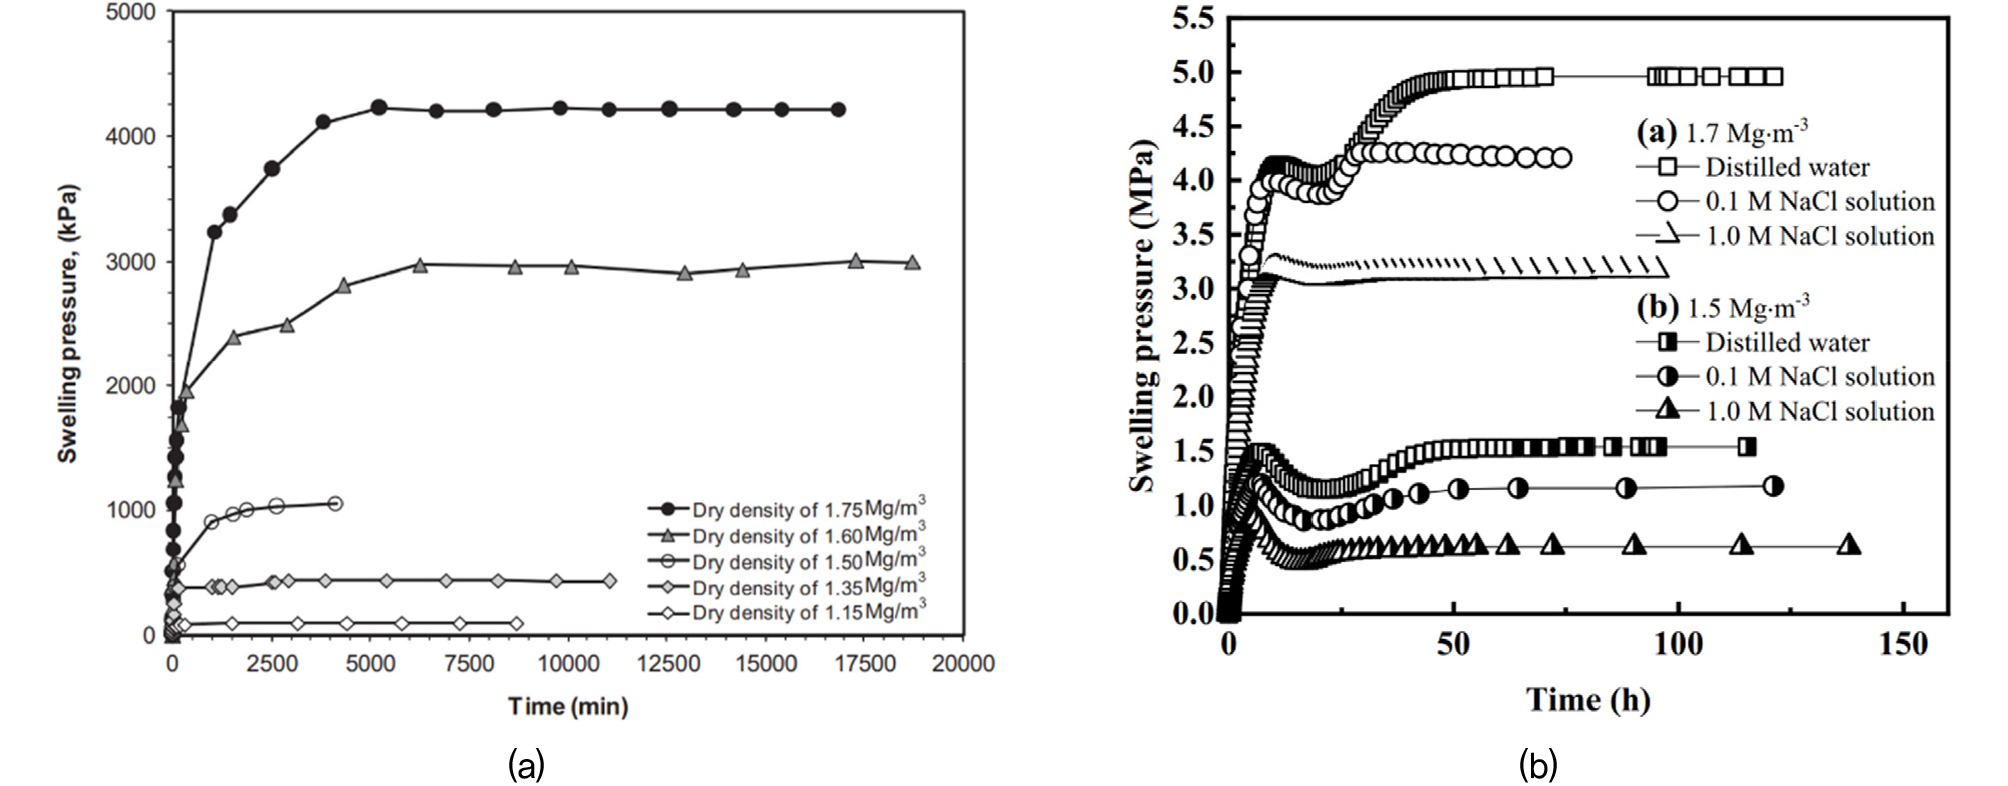
Fig. 13
Swelling pressure of compacted bentonite varying with the dry density: (a) Schanz and Al-Badran, 2014, (b) Lu et al., 2022
4. Conclusions
In this study, numerical analysis was conducted to evaluate the swelling behavior of compacted bentonite buffer blocks using a nonlinear elastic-based hydromechanical coupled analysis technique. After validating the developed analysis model, the swelling behaviors of the bentonite buffer blocks under various experimental conditions, such as different geometric shapes and initial dry densities of the buffer material, were compared, analyzed, and evaluated. The conclusions of this study are as follows.
(1) The swelling behavior analysis results obtained in this study reasonably predicted the results of the swelling pressure tests. Therefore, the analysis model used in this study can be applied in various future studies related to bentonite swelling.
(2) When comparing the swelling behavior of compacted bentonite samples with different shapes (cylindrical and U-shaped) under constant water pressure conditions at the bottom, it was observed that the rate of increase in swelling pressure was much faster in the U-shaped block than in the cylindrical sample. In the U-shaped block, the central region initially exhibited a faster increase in pressure than the outer region. However, this difference gradually decreased over time, reaching the same swelling pressure. Furthermore, there was a localized concentration of swelling pressure near the inner corners in the U-shaped block, which should be closely examined when evaluating the safety of bentonite swelling pressure in disposal systems.
(3) As the dry density of the bentonite buffer material increased, the rate of increase in the swelling pressure accelerated, and the final magnitude of the swelling pressure also increased. Lower dry densities result in wider interparticle gaps, leading to internal swelling deformation to fill the gaps, which reduces the swelling pressure. In contrast, higher dry densities result in narrower gaps, leading to higher swelling pressures.
(4) In this study, a nonlinear elastic model was applied to simulate the swelling behavior of KJ-II bentonite buffer material. However, future research should consider the application of more accurate nonlinear elastoplastic models to simulate the actual behavior of buffer materials better. In addition, it is necessary to increase the reliability of the input data of the simulation model by conducting experiments on various properties of the KJ-II bentonite buffer material.
