Journal of the Korean Geotechnical Society. 30 November 2014. 25-38
https://doi.org/10.7843/kgs.2014.30.11.25

ABSTRACT


MAIN

  • 1. 서 론

  • 2. 입자법 계산방법

  •   2.1 소성변형

  • 3. 모래질 점토의 소성지수 및 비배수전단강도

  • 4. 모래질 점토로 된 흙기둥 붕괴실험

  •   4.1 함수비가 40%인 흙기둥 붕괴실험 결과

  •   4.2 함수비가 60%인 흙기둥 붕괴실험 결과

  •   4.3 함수비가 80%인 경우 흙기둥 붕괴실험 결과

  • 5. 흙기둥 붕괴실험 시뮬레이션

  •   5.1 함수비 80%인 흙기둥의 모래 함유량 증가에 따른 붕괴실험 시뮬레이션

  •   5.2 모래 함유량이 50%인 흙기둥의 함수비 증가에 따른 붕괴실험 시뮬레이션

  • 6. 결 론

1. 서 론

유한요소법(Finite Element Method)과 같이 격자를 사용하는 기존 수치해석법은 토석류와 같은 토사의 흐름이나 지반 융기와 같은 대변형 해석이 어렵다. 하지만, PFC3D (Particle Flow Code in 3 Dimensions)(Itasca Consulting Group, 2005)와 같은 개별요소법(Discrete Element Method) (Cundall and Strack, 1979)은 기본적으로 수직 및 전단 변형에 대한 스프링 상수를 사용하여 입자 간의 분리나 회전 등이 가능하므로 대변형 해석에 적합하다. 한편 개별요소법은 자체적으로 입자 하나 하나의 거동을 모사하기 때문에 추가로 탄소성 구성식이 필요하지 않지만, 앞서 언급한 스프링 상수와 같은 입력변수를 결정하는 것이 다소 애매모호하다는 단점이 있다(Bui et al., 2008). 따라서 Bui et al.(2008), Maeda and Sakai(2004)는 유체해석에 사용하는 입자법(Particle method)을 실내모형실험 결과에 기초한 사면안정해석, 토사유출 등과 같은 다양한 대변형 해석에 적용하였다. 입자법은 연속체역학의 수치 시뮬레이션법으로 연속체 거동을 유한개의 입자 운동으로 계산하는 방법이다. 국내에서도 Park et al. (2013)이 입자법을 이용하여 모래기둥과 점토기둥에 작용하는 하중 증가로 인한 대변형 사례를 예측하고자 하였으며, Mohr-Coulomb과 같이 고체역학에 사용되는 파괴기준을 입자법에 도입한 바 있다.

본 연구에서는 토사의 대변형 해석을 위해 입자법 중의 하나인 MPS법(Moving Particle Semi-implicit)(Koshizuka et al., 1995)에 기초하여 Mohr-Coulomb 파괴기준을 비롯하여 입자법의 점성항에 흙의 소성거동을 도입한 3차원 입자법을 개발하였으며, 이를 검증하기 위하여 흙기둥 붕괴실험을 실시하여 본 해석법의 적용성을 검토하였다. 특히 토사 붕괴가 일어나는 원리는 강우나 지하수위 상승으로 인한 흙의 함수비 증가가 주된 원인이므로 함수비 증가에 따른 토사의 변형 거동을 예측하고자 하였다. 한편 실제 현장에서 발생하는 대형 산사태나 대규모 토사유동과 같은 거동을 해석하기에는 계산할 수 있는 입자 수와 컴퓨터 계산시간 등과 같은 기술적인 한계가 있어 실내에서 흙기둥 붕괴실험을 실시하여 소규모 토사 유동을 관찰한 다음 이를 개발 중인 입자법으로 예측하고자 하였다. 향후 앞서 언급한 문제점들이 개선될 경우 입자법에 기초한 토사 대변형 해석법으로 흙의 파괴 여부와 파괴 이후의 거동이나 유동 범위는 물론 파괴 이전의 토사 변형을 예측한 다음 이를 지반구조물 설계에 반영하거나 이를 바탕으로 기존 구조물을 보강함으로써 토사 대변형으로 인한 인명과 재산 피해를 방지할 수 있다.

2. 입자법 계산방법

입자법에서는 흙의 자중과 변형률에 의해 발생하는 수직응력 http://static.apub.kr/journalsite/sites/kgs/2014-030-11/N0990301103/images/PIC8347.gif를 계산한 다음, 마찰각, 점착력 그리고 수직응력을 이용하여 전단응력 http://static.apub.kr/journalsite/sites/kgs/2014-030-11/N0990301103/images/PIC8377.gifhttp://static.apub.kr/journalsite/sites/kgs/2014-030-11/N0990301103/images/PIC83B6.gif와 같이 계산한다(Park et al., 2013). 본 연구에서는 함수비와 소성지수 변화에 따른 점토질 흙의 소성전단계수 특성을 고려하여 토사의 대변형과 같은 소성변형을 시뮬레이션하였으며, 자세한 계산과정과 수식은 다음과 같다.

2.1 소성변형

본 입자법에서는 흙 입자의 파괴 여부를 결정하기 위해 Mohr-Coulomb 파괴기준을 사용하고 있다. 즉, 점착력 c'와 마찰각 http://static.apub.kr/journalsite/sites/kgs/2014-030-11/N0990301103/images/PIC83D7.gif가 주어졌을 때 수직응력 http://static.apub.kr/journalsite/sites/kgs/2014-030-11/N0990301103/images/PIC83F7.gif에 따라 파괴 여부가 결정된다. 한편 토사에 작용하는 전단응력이 Mohr-Coulomb과 같은 파괴기준에 도달하기 전에도 변형과 동시에 항복으로 인한 소성변형이 발생한다. 이와 같은 흙의 전단거동이나 하중 변화에 따른 소성변형을 경화현상(hardening behavior)이라 한다. 본 연구에서는 이와 같은 점토의 소성변형을 소성전단계수를 이용하여 계산하였다. 점토의 소성변형은 Fig. 1과 같이 전단응력비 http://static.apub.kr/journalsite/sites/kgs/2014-030-11/N0990301103/images/PIC8436.gif의 증가에 따라 결정되며, 소성전단변형률의 발생 정도를 결정하는 소성전단계수 Gp는 식 (1a)와 같이 계산하였다. 여기서 최대소성전단계수(Maximum plastic shear modulus, http://static.apub.kr/journalsite/sites/kgs/2014-030-11/N0990301103/images/PIC8466.gif)는 전단 초기의 소성전단계수 값으로 흙의 비배수전단강도(Undrained shear strength, cu), 소성지수(Plasticity index, PI), 함수비(Water content, w)에 따라 식 (1b)와 같이 정의하였다.

Table 1. Summary of plasticity index and undrained shear strength of sandy-clay

Sand content (%)

Plasticity index, PI

Undrained shear strength, cu (kPa)

Water content,

w = 40%

Water content,

w = 60%

Water content,

w = 80%

0

26

28

9.8

3.4

10

24

24

6

2.6

25

22

23

4

2.1

50

18

3

0.8

-

Table 2. Material properties of Nakdong River sand

Specific gravity Gs

D10 (mm)

D50 (mm)

Cu

Cc

emax

emin

USCS

2.637

0.19

0.24

1.32

1.04

1.181

0.849

SP

*Note: D10 = effective grain size; D50 = mean grain size; Cu = coefficient of uniformity; Cc = coefficient of curvature; emax = maximum void ratio; emin = minimum void ratio; USCS = Unified Soil Classification System.

http://static.apub.kr/journalsite/sites/kgs/2014-030-11/N0990301103/images/PIC8523.gif (1a)

http://static.apub.kr/journalsite/sites/kgs/2014-030-11/N0990301103/images/PIC85A1.gif (1b)

여기서 Pa는 대기압이다. 식 (1b)는 Massarsch(2004)가 점토의 탄성전단계수를 소성지수 등과 같은 흙의 공학적 특성을 이용하여 정의한 것과 유사한 형태로, 본 연구에서는 이를 소성변형을 위한 변수로 수정하여 사용하였다.

한편 입자법 계산에 사용한 입자의 점성 또는 유동을 결정하는 동점성계수(Kinetic viscosity) ν는 소성전단계수 Gp의 변화에 따라 다음 식 (2)와 같이 정의하였다.

http://static.apub.kr/journalsite/sites/kgs/2014-030-11/N0990301103/images/PIC864E.gif

Fig. 1. Hardening behavior of soils

http://static.apub.kr/journalsite/sites/kgs/2014-030-11/N0990301103/images/PIC866E.gif  (2)

여기서 νw는 물의 동점성계수이다(1×10⁻⁶m2/s). 즉, 본 입자법에서는 흙의 거동을 점성 유체로 가정하여 흙의 항복으로 인한 경화현상을 시뮬레이션하였다. 흙의 종류에 따라 소성전단계수 값이 다르며, 이는 입자법에서 서로 다른 동점성계수를 적용하게 된다. 흙의 파괴 이전에 발생하는 소성변형을 시뮬레이션하기 위해서는 식 (2)를 이용하여 동점성계수를 변화시켰으며, 흙이 파괴기준을 만족할 경우에는 흙의 점성이 물과 같이 된다. 하지만 파괴 이전에는 응력비에 해당하는 전단소성계수에 따라 점성이 결정된다.

3. 모래질 점토의 소성지수 및 비배수전단강도

입자법 계산에서 필요한 입력변수 중 가장 중요한 것은 흙의 변형 정도를 결정하는 소성전단계수이며, 이것은 흙의 비배수전단강도, 소성지수, 또는 함수비와 관련 있다(Massarsch, 2004). 본 연구에서는 먼저 카올리나이트에 낙동강모래를 0, 10, 25, 그리고 50% 혼합한 다음, 각각의 시료에 대한 소성지수를 측정하였다. 또한 함수비를 40, 60, 그리고 80%로 증가시키면서 토베인을 이용하여 비배수전단강도 cu를 측정하였으며, 그 결과는 Table 1과 같다. 본 연구에서 사용한 카올리나이트의 비중은 2.47이며, 액성한계와 소성한계는 70과 40이다. 낙동강모래의 기본 물성치는 Table 2와 같으며, 통일분류법 상 빈입도 모래(SP)로 분류된다. 낙동강모래는 실리카(이산화규소)가 78% 이상인 실리카질 모래로 입자는 약간 모난 형태를 하고 있으며 색깔은 다소 붉은 색을 띠고 있다. 모래 함유량(Sand content) 증가에 따라 소성지수는 감소하였으며, 함수비 증가에 따라 비배수전단강도는 감소하였다. 모래가 없는 경우에는 점토가 전단 시 비배수 거동을 보이지만, 모래가 점점 증가하면서 완전한 비배수상태가 아닌 일부에서 배수가 발생하면서 비배수전단강도가 감소한 것으로 판단된다.

한편 Massarsch(2004)의 연구결과를 참조하여 본 실험에서 측정된 소성지수와 비배수전단강도는 흙의 대변형 해석에 필요한 소성전단계수를 구하는데 사용되었다.

4. 모래질 점토로 된 흙기둥 붕괴실험

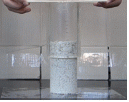
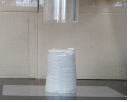
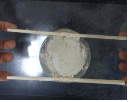
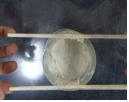
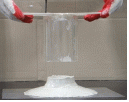
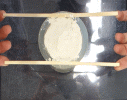
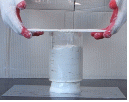
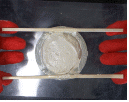
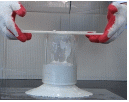
모래가 포함된 점토의 함수비 증가에 따른 흙의 유동을 관찰하기 위해 흙기둥 붕괴실험을 실시하였다. 제3장에서 실험한 모래질 점토와 동일하게 카올리나이트에 낙동강모래를 0, 10, 25, 또는 50% 혼합한 다음 약간의 비배수전단강도를 가지는 액성한계에 해당하는 60%의 함수비로 흙기둥을 제작하였다. 또한 액성한계 상태뿐 아니라 액성한계에 도달하기 전과 후의 함수비인 40%와 80%로도 흙기둥을 제작하여 토사의 흐름을 관찰하였다. 흙기둥 높이를 5등분하여 각 층마다 정해진 양의 흙과 증류수를 교반함으로써 모래가 골고루 분포하도록 하였으며, 흙과 플라스틱 기둥의 마찰을 방지하기 위해 윤활제(WD-40)를 뿌린 내경이 7cm인 플라스틱 원기둥에 교반된 흙을 넣어 표면을 정리하였다. 그리고 플라스틱 원기둥을 1.1초 동안에 빠른 속도로 들어올려 흙의 흐름을 관찰하였으며, 이와 같은 작업을 동일한 실험자가 반복적으로 동일한 속도로 들어올림으로써 실험 오차를 최대한 줄이고자 하였다. 흙기둥에 포함된 함수비와 모래 함유량에 따른 실험 종류와 명칭을 Table 3에 정리하였으며, 붕괴과정을 촬영한 다음 이를 이용하여 개발된 입자법 수치해석법의 적용성을 검토하였다. 먼저 함수비에 따른 실험 결과는 다음과 같다.

Table 3. Types of Soil column tests with different water content and sand content

Water content,

w (%)

Sand content (%)

0

10

25

50

40

40W 0S

40W 10S

40W 25S

40W 50S

60

60W 0S

60W 10S

60W 25S

60W 50S

80

80W 0S

80W 10S

80W 25S

80W 50S

Time

0.0 sec

0.3 sec

0.6 sec

1.1 sec

Side view

http://static.apub.kr/journalsite/sites/kgs/2014-030-11/N0990301103/images/PIC86CD.gif

http://static.apub.kr/journalsite/sites/kgs/2014-030-11/N0990301103/images/PIC871C.gif

http://static.apub.kr/journalsite/sites/kgs/2014-030-11/N0990301103/images/PIC875B.gif

http://static.apub.kr/journalsite/sites/kgs/2014-030-11/N0990301103/images/PIC87BA.gif

Top view

http://static.apub.kr/journalsite/sites/kgs/2014-030-11/N0990301103/images/PIC8809.gif

http://static.apub.kr/journalsite/sites/kgs/2014-030-11/N0990301103/images/PIC8904.gif

http://static.apub.kr/journalsite/sites/kgs/2014-030-11/N0990301103/images/PIC89B1.gif

http://static.apub.kr/journalsite/sites/kgs/2014-030-11/N0990301103/images/PIC89F0.gif

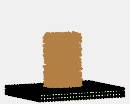
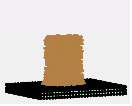
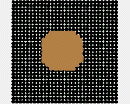
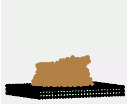
Fig. 2. Result of sandy-clay column flow test with 40% water content and 0% sand content

4.1 함수비가 40%인 흙기둥 붕괴실험 결과

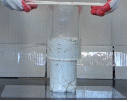
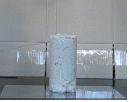
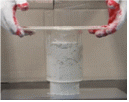
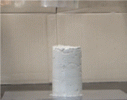
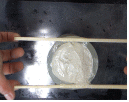
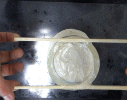
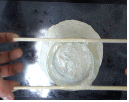
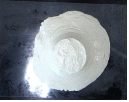
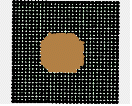
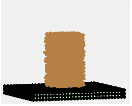
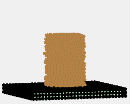
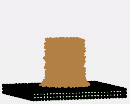
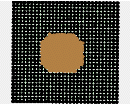
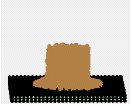
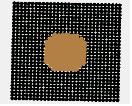
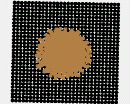
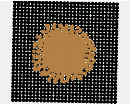
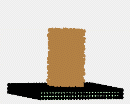
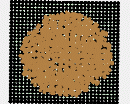
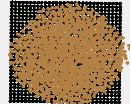
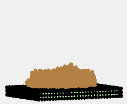
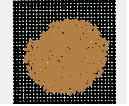
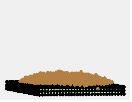
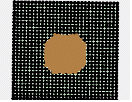
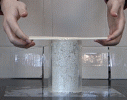
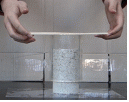
Fig. 2, 3, 4, 그리고 5는 카올리나이트에 모래가 각각 0, 10, 25, 그리고 50% 혼합된 함수비 40%의 흙기둥 붕괴실험 결과이다. 모래 함유량이 0, 10, 그리고 25%인 경우에는 실험 전과 후의 흙기둥 크기는 변화 없이 직경 7cm, 높이 13cm를 유지하였다. 하지만 모래 함유량이 50%인 경우에는 실험 후 흙기둥의 크기가 최대직경 7.6cm, 높이 12.1cm로 변형되었다. 함수비가 40%로 액성한계보다 낮아 모래 함유량에 관계없이 전반적으로 큰 변형이 발생하지 않았으나, 모래 함유량이 50%로 증가할 경우 카올리나이트의 비배수전단강도가 3kPa로 낮아지면서 약간의 변형이 발생한 것으로 판단된다.
Time

0.0 sec

0.3 sec

0.6 sec

1.1 sec

Side view

http://static.apub.kr/journalsite/sites/kgs/2014-030-11/N0990301103/images/PIC8A6E.gif

http://static.apub.kr/journalsite/sites/kgs/2014-030-11/N0990301103/images/PIC8AFC.gif

http://static.apub.kr/journalsite/sites/kgs/2014-030-11/N0990301103/images/PIC8BE7.gif

http://static.apub.kr/journalsite/sites/kgs/2014-030-11/N0990301103/images/PIC8C75.gif

Top view

http://static.apub.kr/journalsite/sites/kgs/2014-030-11/N0990301103/images/PIC8D41.gif

http://static.apub.kr/journalsite/sites/kgs/2014-030-11/N0990301103/images/PIC8D81.gif

http://static.apub.kr/journalsite/sites/kgs/2014-030-11/N0990301103/images/PIC8DC0.gif

http://static.apub.kr/journalsite/sites/kgs/2014-030-11/N0990301103/images/PIC8E0F.gif

Fig. 3. Result of sandy-clay column flow test with 40% water content and 10% sand content

Time

0.0 sec

0.3 sec

0.6 sec

1.1 sec

Side view

http://static.apub.kr/journalsite/sites/kgs/2014-030-11/N0990301103/images/PIC8E6E.gif

http://static.apub.kr/journalsite/sites/kgs/2014-030-11/N0990301103/images/PIC8ECD.gif

http://static.apub.kr/journalsite/sites/kgs/2014-030-11/N0990301103/images/PIC8F0C.gif

http://static.apub.kr/journalsite/sites/kgs/2014-030-11/N0990301103/images/PIC8F3C.gif

Top view

http://static.apub.kr/journalsite/sites/kgs/2014-030-11/N0990301103/images/PIC8F8B.gif

http://static.apub.kr/journalsite/sites/kgs/2014-030-11/N0990301103/images/PIC8FCB.gif

http://static.apub.kr/journalsite/sites/kgs/2014-030-11/N0990301103/images/PIC9039.gif

http://static.apub.kr/journalsite/sites/kgs/2014-030-11/N0990301103/images/PIC9163.gif

Fig. 4. Result of sandy-clay column flow test with 40% water content and 25% sand content

Time

0.0 sec

0.3 sec

0.6 sec

1.1 sec

Side view

http://static.apub.kr/journalsite/sites/kgs/2014-030-11/N0990301103/images/PIC91A3.gif

http://static.apub.kr/journalsite/sites/kgs/2014-030-11/N0990301103/images/PIC925F.gif

http://static.apub.kr/journalsite/sites/kgs/2014-030-11/N0990301103/images/PIC928F.gif

http://static.apub.kr/journalsite/sites/kgs/2014-030-11/N0990301103/images/PIC92CE.gif

Top view

http://static.apub.kr/journalsite/sites/kgs/2014-030-11/N0990301103/images/PIC932D.gif

http://static.apub.kr/journalsite/sites/kgs/2014-030-11/N0990301103/images/PIC936D.gif

http://static.apub.kr/journalsite/sites/kgs/2014-030-11/N0990301103/images/PIC939D.gif

http://static.apub.kr/journalsite/sites/kgs/2014-030-11/N0990301103/images/PIC93DC.gif

Fig. 5. Result of sandy-clay column flow test with 40% water content and 50% sand content

4.2 함수비가 60%인 흙기둥 붕괴실험 결과

Fig. 6, 7, 8, 그리고 9는 카올리나이트에 모래가 각각 0, 10, 25, 그리고 50% 혼합된 함수비 60%의 흙기둥 붕괴실험 결과이다. 모래 함유량이 0%와 10%인 경우에 실험 전과 후의 흙기둥의 크기는 변화 없이 직경 7cm, 높이 13cm를 유지하였다. 모래 함유량이 25%인 경우에는 기둥 아래 부분이 약간 무너지면서 실험 후 1.1초에 흙기둥이 최대직경 8.4cm, 높이 11cm로 변형되었다. 모래 함유량이 50%인 경우에는 흙기둥의 거동이 점성이 조금 높은 유체와 같이 흘러내렸으며, 실험 후 흙기둥의 크기는 기둥 아래 최대직경 20.2cm, 높이 5cm로 변형되었다. 모래 함유량이 증가할수록 흙기둥의 비배수전단강도가 감소하면서 변형이 점점 증가하는 경향을 보였다.

Time

0.0 sec

0.3 sec

0.6 sec

1.1 sec

Side view

http://static.apub.kr/journalsite/sites/kgs/2014-030-11/N0990301103/images/PIC9719.gif

http://static.apub.kr/journalsite/sites/kgs/2014-030-11/N0990301103/images/PIC97D6.gif

http://static.apub.kr/journalsite/sites/kgs/2014-030-11/N0990301103/images/PIC9863.gif

http://static.apub.kr/journalsite/sites/kgs/2014-030-11/N0990301103/images/PIC9910.gif

Top view

http://static.apub.kr/journalsite/sites/kgs/2014-030-11/N0990301103/images/PIC995F.gif

http://static.apub.kr/journalsite/sites/kgs/2014-030-11/N0990301103/images/PIC99CE.gif

http://static.apub.kr/journalsite/sites/kgs/2014-030-11/N0990301103/images/PIC9A5B.gif

http://static.apub.kr/journalsite/sites/kgs/2014-030-11/N0990301103/images/PIC9C12.gif

Fig. 6. Result of sandy-clay column flow test with 60% water content and 0% sand content

Time

0.0 sec

0.3 sec

0.6 sec

1.1 sec

Side view

http://static.apub.kr/journalsite/sites/kgs/2014-030-11/N0990301103/images/PIC9C71.gif

http://static.apub.kr/journalsite/sites/kgs/2014-030-11/N0990301103/images/PIC9CB0.gif

http://static.apub.kr/journalsite/sites/kgs/2014-030-11/N0990301103/images/PIC9CF0.gif

http://static.apub.kr/journalsite/sites/kgs/2014-030-11/N0990301103/images/PIC9D3F.gif

Top view

http://static.apub.kr/journalsite/sites/kgs/2014-030-11/N0990301103/images/PIC9EE6.gif

http://static.apub.kr/journalsite/sites/kgs/2014-030-11/N0990301103/images/PIC9F64.gif

http://static.apub.kr/journalsite/sites/kgs/2014-030-11/N0990301103/images/PICA05F.gif

http://static.apub.kr/journalsite/sites/kgs/2014-030-11/N0990301103/images/PICA33E.gif

Fig. 7. Result of sandy-clay column flow test with 60% water content and 10% sand content

Time

0.0 sec

0.3 sec

0.6 sec

1.1 sec

Side view

http://static.apub.kr/journalsite/sites/kgs/2014-030-11/N0990301103/images/PICA439.gif

http://static.apub.kr/journalsite/sites/kgs/2014-030-11/N0990301103/images/PICA5C1.gif

http://static.apub.kr/journalsite/sites/kgs/2014-030-11/N0990301103/images/PICA823.gif

http://static.apub.kr/journalsite/sites/kgs/2014-030-11/N0990301103/images/PICA8EF.gif

Top view

http://static.apub.kr/journalsite/sites/kgs/2014-030-11/N0990301103/images/PICA96D.gif

http://static.apub.kr/journalsite/sites/kgs/2014-030-11/N0990301103/images/PICABEF.gif

http://static.apub.kr/journalsite/sites/kgs/2014-030-11/N0990301103/images/PICAC4D.gif

http://static.apub.kr/journalsite/sites/kgs/2014-030-11/N0990301103/images/PICACAC.gif

Fig. 8. Result of sandy-clay column flow test with 60% water content and 25% sand content

4.3 함수비가 80%인 경우 흙기둥 붕괴실험 결과

Time

0.0 sec

0.3 sec

0.6 sec

1.1 sec

Side view

http://static.apub.kr/journalsite/sites/kgs/2014-030-11/N0990301103/images/PICAD0B.gif

http://static.apub.kr/journalsite/sites/kgs/2014-030-11/N0990301103/images/PICAEF0.gif

http://static.apub.kr/journalsite/sites/kgs/2014-030-11/N0990301103/images/PICB02A.gif

http://static.apub.kr/journalsite/sites/kgs/2014-030-11/N0990301103/images/PICB0A8.gif

Top view

http://static.apub.kr/journalsite/sites/kgs/2014-030-11/N0990301103/images/PICB27E.gif

http://static.apub.kr/journalsite/sites/kgs/2014-030-11/N0990301103/images/PICB34A.gif

http://static.apub.kr/journalsite/sites/kgs/2014-030-11/N0990301103/images/PICB54E.gif

http://static.apub.kr/journalsite/sites/kgs/2014-030-11/N0990301103/images/PICB8CA.gif

Fig. 9. Result of sandy-clay column flow test with 60% water content and 50% sand content

Time

0.0 sec

0.3 sec

0.6 sec

1.1 sec

Side view

http://static.apub.kr/journalsite/sites/kgs/2014-030-11/N0990301103/images/PICBB8A.gif

http://static.apub.kr/journalsite/sites/kgs/2014-030-11/N0990301103/images/PICBCD3.gif

http://static.apub.kr/journalsite/sites/kgs/2014-030-11/N0990301103/images/PICC783.gif

http://static.apub.kr/journalsite/sites/kgs/2014-030-11/N0990301103/images/PICD6A7.gif

Top view

http://static.apub.kr/journalsite/sites/kgs/2014-030-11/N0990301103/images/PICE686.gif

http://static.apub.kr/journalsite/sites/kgs/2014-030-11/N0990301103/images/PIC15E4.gif

http://static.apub.kr/journalsite/sites/kgs/2014-030-11/N0990301103/images/PIC1D09.gif

http://static.apub.kr/journalsite/sites/kgs/2014-030-11/N0990301103/images/PIC1F5C.gif

Fig. 10. Result of sand-clay column flow test with 80% water content and 0% sand content

Time

0.0 sec

0.3 sec

0.6 sec

1.1 sec

Side view

http://static.apub.kr/journalsite/sites/kgs/2014-030-11/N0990301103/images/PIC26B0.gif

http://static.apub.kr/journalsite/sites/kgs/2014-030-11/N0990301103/images/PIC4AB4.gif

http://static.apub.kr/journalsite/sites/kgs/2014-030-11/N0990301103/images/PIC58FD.gif

http://static.apub.kr/journalsite/sites/kgs/2014-030-11/N0990301103/images/PIC60CE.gif

Top view

http://static.apub.kr/journalsite/sites/kgs/2014-030-11/N0990301103/images/PIC69C8.gif

http://static.apub.kr/journalsite/sites/kgs/2014-030-11/N0990301103/images/PIC7300.gif

http://static.apub.kr/journalsite/sites/kgs/2014-030-11/N0990301103/images/PIC80AD.gif

http://static.apub.kr/journalsite/sites/kgs/2014-030-11/N0990301103/images/PIC87D2.gif

Fig. 11. Result of sand-clay column flow test with 80% water content and 10% sand content

Fig. 10, 11, 12, 그리고 13은 카올리나이트에 모래 각각 0, 10, 25, 그리고 50% 혼합된 함수비 80%의 흙기둥 붕괴실험 결과이다. 붕괴실험 전의 흙기둥은 직경 7cm, 높이 13cm이다. 모래 함유량이 0%인 경우에는 실험 전과 후의 흙기둥의 크기는 변화 없이 직경 7cm, 높이 13cm이다. 모래 함유량이 10%인 경우 흙기둥은 점성이 높은 유체와 같이 흘러내렸으며, 실험 후 최대직경 11.4cm, 높이 9.3cm로 변형되었다. 모래 함유량이 25%인 경우, 흙기둥은 점성이 약간 높은 유체와 같이 흘러내렸으며, 최대직경 18.5cm, 높이 6.6cm로 변형되었다. 모래 함유량이 50%인 경우에 강도 측정이 거의 불가능하여 흙기둥은 점성이 물보다 약간 높은 유체와 같이 흘러내렸으며, 실험 후 흙기둥의 크기는 최대직경 22.1cm, 높이 1.8cm로 변형되었다.

Time

0.0 sec

0.3 sec

0.6 sec

1.1 sec

Side view

http://static.apub.kr/journalsite/sites/kgs/2014-030-11/N0990301103/images/PIC91D6.gif

http://static.apub.kr/journalsite/sites/kgs/2014-030-11/N0990301103/images/PIC992A.gif

http://static.apub.kr/journalsite/sites/kgs/2014-030-11/N0990301103/images/PICA168.gif

http://static.apub.kr/journalsite/sites/kgs/2014-030-11/N0990301103/images/PICA6E7.gif

Top view

http://static.apub.kr/journalsite/sites/kgs/2014-030-11/N0990301103/images/PICADBE.gif

http://static.apub.kr/journalsite/sites/kgs/2014-030-11/N0990301103/images/PICB4B5.gif

http://static.apub.kr/journalsite/sites/kgs/2014-030-11/N0990301103/images/PICBA05.gif

http://static.apub.kr/journalsite/sites/kgs/2014-030-11/N0990301103/images/PICBDCF.gif

Fig. 12. Result of sand-clay column flow test with 80% water content and 25% sand content

Time

0.0 sec

0.3 sec

0.6 sec

1.1 sec

Side view

http://static.apub.kr/journalsite/sites/kgs/2014-030-11/N0990301103/images/PICC189.gif

http://static.apub.kr/journalsite/sites/kgs/2014-030-11/N0990301103/images/PICC5B0.gif

http://static.apub.kr/journalsite/sites/kgs/2014-030-11/N0990301103/images/PICD1B8.gif

http://static.apub.kr/journalsite/sites/kgs/2014-030-11/N0990301103/images/PICD5CF.gif

Top view

http://static.apub.kr/journalsite/sites/kgs/2014-030-11/N0990301103/images/PICDC68.gif

http://static.apub.kr/journalsite/sites/kgs/2014-030-11/N0990301103/images/PICE061.gif

http://static.apub.kr/journalsite/sites/kgs/2014-030-11/N0990301103/images/PICE265.gif

http://static.apub.kr/journalsite/sites/kgs/2014-030-11/N0990301103/images/PICE516.gif

Fig. 13. Result of sand-clay column flow test with 80% water content and 50% sand content

Table 4. Summary of sandy-clay column tests

Water content,

w (%)

Sand content (%)

0

10

25

50

40

Max. Dia. = 7 cm

Max. Height = 13 cm

Max. Dia. = 7 cm

Max. Height = 13 cm

Max. Dia. = 7 cm

Max. Height = 13 cm

Max. Dia. = 7.6 cm

Max. Height = 12.1 cm

60

Max. Dia. = 7 cm

Max. Height = 13 cm

Max. Dia. = 7 cm

Max. Height = 13 cm

Max. Dia. = 8.4 cm

Max. Height = 11 cm

Max. Dia. = 20.2 cm

Max. Height = 5 cm

80

Max. Dia. = 7 cm

Max. Height = 13 cm

Max. Dia. = 11.4 cm

Max. Height = 9.3 cm

Max. Dia. = 18.5 cm

Max. Height = 6.6 cm

Max. Dia. = 22.1 cm

Max. Height = 1.8 cm

*Note: Max. Dia. = Maximum diameter, Max. Height = Maximum height

Table 4는 흙기둥 붕괴실험으로부터 관찰된 각각의 경우에 대한 흙기둥 붕괴 후의 최대직경과 높이를 비교하였다.

5. 흙기둥 붕괴실험 시뮬레이션

함수비 또는 모래 함유량이 토사의 대변형에 미치는 영향을 관찰하기 위하여 흙기둥 붕괴실험을 실시하였으며, 본 연구에서 개발한 입자법을 이용하여 변형이 크게 발생한 흙기둥의 직경과 높이 변화를 예측 비교하였으며, 응력 변화도 계산하였다.

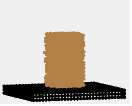
Table 5. Input parameters for Particle method

Water content, w (%)

Sand content

(%)

Friction angle (deg)

cu

(kPa)

PI

GPmax

(kPa)

Kinetic viscosity

(m2/s)

80

0

32

3.4

26

11,651

0.13

10

26

2.6

24

8,128

0.09

25

20

2.1

22

5,709

0.06

50

17

0.2

18

995

0.01

40

50

17

3

18

11,960

0.13

60

17

0.8

18

3,291

0.04

80

17

0.2

18

995

0.01

*Note: cu = Undrained shear strength; PI = Plasticity index; GPmax = Maximum plastic shear modulus

Time

0.0 sec

0.3 sec

0.6 sec

1.1 sec

Side view

http://static.apub.kr/journalsite/sites/kgs/2014-030-11/N0990301103/images/PICE8C0.gif

http://static.apub.kr/journalsite/sites/kgs/2014-030-11/N0990301103/images/PICE900.gif

http://static.apub.kr/journalsite/sites/kgs/2014-030-11/N0990301103/images/PICE94F.gif

http://static.apub.kr/journalsite/sites/kgs/2014-030-11/N0990301103/images/PICE9FC.gif

Top view

http://static.apub.kr/journalsite/sites/kgs/2014-030-11/N0990301103/images/PICEA99.gif

http://static.apub.kr/journalsite/sites/kgs/2014-030-11/N0990301103/images/PICEB36.gif

http://static.apub.kr/journalsite/sites/kgs/2014-030-11/N0990301103/images/PICEB66.gif

http://static.apub.kr/journalsite/sites/kgs/2014-030-11/N0990301103/images/PICEC03.gif

Fig. 14. Result of sand-clay column flow test with 80% water content and 0% sand content

Time

0.0 sec

0.3 sec

0.6 sec

1.1 sec

Side view

http://static.apub.kr/journalsite/sites/kgs/2014-030-11/N0990301103/images/PICEC81.gif

http://static.apub.kr/journalsite/sites/kgs/2014-030-11/N0990301103/images/PICECB1.gif

http://static.apub.kr/journalsite/sites/kgs/2014-030-11/N0990301103/images/PICED00.gif

http://static.apub.kr/journalsite/sites/kgs/2014-030-11/N0990301103/images/PICED40.gif

Top view

http://static.apub.kr/journalsite/sites/kgs/2014-030-11/N0990301103/images/PICEDBE.gif

http://static.apub.kr/journalsite/sites/kgs/2014-030-11/N0990301103/images/PICEF07.gif

http://static.apub.kr/journalsite/sites/kgs/2014-030-11/N0990301103/images/PICEF56.gif

http://static.apub.kr/journalsite/sites/kgs/2014-030-11/N0990301103/images/PICF061.gif

Fig. 15. Result of sand-clay column flow test with 80% water content and 10% sand content

5.1 함수비 80%인 흙기둥의 모래 함유량 증가에 따른 붕괴실험 시뮬레이션

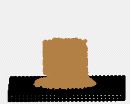
모래질 점토 흙기둥의 함수비 40, 60, 그리고 80% 중에서 가장 변형이 크게 발생한 함수비 80%인 경우에 대하여 입자법 시뮬레이션을 실시하였으며, 흙기둥의 크기는 실험 공시체의 크기와 동일하게 직경 7cm, 높이 13cm로 설정하였다. 즉, 함수비가 80%인 모래질 점토기둥의 모래 함유량이 0, 10, 25, 그리고 50%로 증가함에 따른 변형을 입자법으로 시뮬레이션하였다. Table 5는 입자법 수치해석에 사용한 입력변수인 Friction angle (마찰각), cu(점착력), 그리고 Kinetic viscosity(동점성계수)를 비교하고 있다. Fig. 14, 15, 16, 그리고 17은 각각의 시뮬레이션 결과를 비교하고 있다. 모래 함유량이 0, 10, 25, 그리고 50%로 증가함에 따라 흙기둥의 직경은 7.7cm(7cm), 10.92cm(11.4cm), 18cm(18.5cm), 그리고 21cm(22.1cm)로 증가하였으며, 높이는 12.54cm(13cm), 11.62cm(9.3cm), 4.3cm(6.6cm), 그리고 2.7cm(1.8cm)로 감소하였다(괄호 안의 값은 실험 결과임). Table 4의 실험 결과와 비교하였을 때, 직경과 높이의 변화는 1-2cm 정도의 차이가 발생하였으나, 비교적 서로 잘 일치하는 것으로 나타났다. 한편, Fig. 18은 물의 동점성계수를 이용하여 흙기둥이 아닌 물기둥으로 시뮬레이션한 결과로 이것은 기존 Koshizuka et al.(1995)이 개발한 입자법으로 해석한 결과와 유사하다.

Time

0.0 sec

0.3 sec

0.6 sec

1.1 sec

Side view

http://static.apub.kr/journalsite/sites/kgs/2014-030-11/N0990301103/images/PICF19A.gif

http://static.apub.kr/journalsite/sites/kgs/2014-030-11/N0990301103/images/PICF1DA.gif

http://static.apub.kr/journalsite/sites/kgs/2014-030-11/N0990301103/images/PICF229.gif

http://static.apub.kr/journalsite/sites/kgs/2014-030-11/N0990301103/images/PICF259.gif

Top view

http://static.apub.kr/journalsite/sites/kgs/2014-030-11/N0990301103/images/PICF3F0.gif

http://static.apub.kr/journalsite/sites/kgs/2014-030-11/N0990301103/images/PICF4DB.gif

http://static.apub.kr/journalsite/sites/kgs/2014-030-11/N0990301103/images/PICF54A.gif

http://static.apub.kr/journalsite/sites/kgs/2014-030-11/N0990301103/images/PICF5E7.gif

Fig. 16. Result of sand-clay column flow test with 80% water content and 25% sand content

Time

0.0 sec

0.3 sec

0.6 sec

1.1 sec

Side view

http://static.apub.kr/journalsite/sites/kgs/2014-030-11/N0990301103/images/PICF740.gif

http://static.apub.kr/journalsite/sites/kgs/2014-030-11/N0990301103/images/PICF77F.gif

http://static.apub.kr/journalsite/sites/kgs/2014-030-11/N0990301103/images/PICF79F.gif

http://static.apub.kr/journalsite/sites/kgs/2014-030-11/N0990301103/images/PICF80E.gif

Top view

http://static.apub.kr/journalsite/sites/kgs/2014-030-11/N0990301103/images/PICF8F9.gif

http://static.apub.kr/journalsite/sites/kgs/2014-030-11/N0990301103/images/PICF948.gif

http://static.apub.kr/journalsite/sites/kgs/2014-030-11/N0990301103/images/PICF9F5.gif

http://static.apub.kr/journalsite/sites/kgs/2014-030-11/N0990301103/images/PICFAF0.gif

Fig. 17. Result of sand-clay column flow test with 80% water content and 50% sand content

Time

0.0 sec

0.3 sec

0.6 sec

1.1 sec

Side view

http://static.apub.kr/journalsite/sites/kgs/2014-030-11/N0990301103/images/PICFC59.gif

http://static.apub.kr/journalsite/sites/kgs/2014-030-11/N0990301103/images/PICFCF6.gif

http://static.apub.kr/journalsite/sites/kgs/2014-030-11/N0990301103/images/PICFE9D.gif

http://static.apub.kr/journalsite/sites/kgs/2014-030-11/N0990301103/images/PICFF0B.gif

Top view

http://static.apub.kr/journalsite/sites/kgs/2014-030-11/N0990301103/images/PICFF89.gif

http://static.apub.kr/journalsite/sites/kgs/2014-030-11/N0990301103/images/PIC65.gif

http://static.apub.kr/journalsite/sites/kgs/2014-030-11/N0990301103/images/PIC112.gif

http://static.apub.kr/journalsite/sites/kgs/2014-030-11/N0990301103/images/PIC151.gif

Fig. 18. Results of water column flow test

Time

0.0 sec

0.3 sec

0.6 sec

1.1 sec

Side view

http://static.apub.kr/journalsite/sites/kgs/2014-030-11/N0990301103/images/PIC22D.gif

http://static.apub.kr/journalsite/sites/kgs/2014-030-11/N0990301103/images/PIC451.gif

http://static.apub.kr/journalsite/sites/kgs/2014-030-11/N0990301103/images/PIC4B0.gif

http://static.apub.kr/journalsite/sites/kgs/2014-030-11/N0990301103/images/PIC51E.gif

Top view

http://static.apub.kr/journalsite/sites/kgs/2014-030-11/N0990301103/images/PIC686.gif

http://static.apub.kr/journalsite/sites/kgs/2014-030-11/N0990301103/images/PIC743.gif

http://static.apub.kr/journalsite/sites/kgs/2014-030-11/N0990301103/images/PIC7C1.gif

http://static.apub.kr/journalsite/sites/kgs/2014-030-11/N0990301103/images/PIC86E.gif

Fig. 19. Result of sand-clay column flow test with 40% water content and 50% sand content

Time

0.0 sec

0.3 sec

0.6 sec

1.1 sec

Side view

http://static.apub.kr/journalsite/sites/kgs/2014-030-11/N0990301103/images/PIC8BD.gif

http://static.apub.kr/journalsite/sites/kgs/2014-030-11/N0990301103/images/PIC92B.gif

http://static.apub.kr/journalsite/sites/kgs/2014-030-11/N0990301103/images/PIC9C8.gif

http://static.apub.kr/journalsite/sites/kgs/2014-030-11/N0990301103/images/PICAC3.gif

Top view

http://static.apub.kr/journalsite/sites/kgs/2014-030-11/N0990301103/images/PICCD8.gif

http://static.apub.kr/journalsite/sites/kgs/2014-030-11/N0990301103/images/PICDC3.gif

http://static.apub.kr/journalsite/sites/kgs/2014-030-11/N0990301103/images/PICE70.gif

http://static.apub.kr/journalsite/sites/kgs/2014-030-11/N0990301103/images/PICF0D.gif

Fig. 20. Result of sand-clay column flow test with 60% water content and 50% sand content

5.2 모래 함유량이 50%인 흙기둥의 함수비 증가에 따른 붕괴실험 시뮬레이션

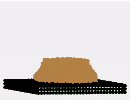
모래 함유량이 50%인 흙기둥의 함수비가 40, 60, 그리고 80%로 증가함에 따른 변형을 입자법으로 시뮬레이션하였다. 흙기둥의 크기는 실험 공시체의 크기와 동일하게 직경 7cm, 높이 13cm로 설정하였으며, 시뮬레이션 결과는 Fig. 19, 20, 그리고 21과 같다. 함수비가 40, 60, 그리고 80%로 증가함에 따라 흙기둥의 직경은 7.7cm (7.6cm), 14.92cm(20.2cm), 그리고 21cm(22.1cm)로 증가하였으며, 높이는 12.54cm(12.1cm), 6.2cm(5cm), 그리고 2.7cm(1.8cm)로 감소하였다. 함수비가 60%인 경우에는 실험 결과와 시뮬레이션 결과가 다소 차이가 발생하였으나, 일반적으로 흙기둥의 변형 정도를 잘 예측한 것으로 판단되었다.

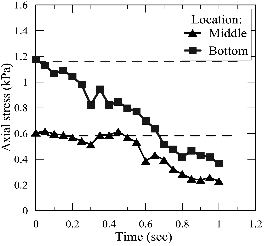
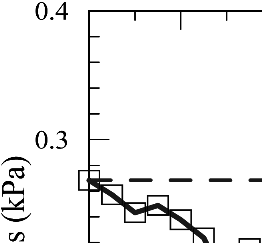
모래 함유량이 50%인 흙기둥의 함수비가 40% 및 60%인 경우에 대하여 흙기둥이 붕괴되면서 중간 및 아래 부분에 작용하는 시간에 따른 수직응력과 전단응력을 입자법으로 계산하였으며, 그 결과를 Fig. 22-23에 비교하였다. 응력 계산 지점은 높이 13cm, 직경 7cm인 흙기둥의 위쪽에서 6.5cm 떨어진 중간지점과 13cm 떨어진 아래지점이다. 함수비가 40%인 경우 초기 흙기둥 무게는 750g, 건조밀도는 1.1g/cm3으로 입자법 계산 결과와 같이 기둥 아래지점의 초기수직응력은 1.4kPa, 중간지점의 초기수직응력은 0.7kPa으로 계산되었다. 함수비가 60%인 경우 초기 흙기둥 무게는 706g, 건조밀도는 0.9g/cm3으로 입자법 계산 결과와 같이 기둥 아래지점의 초기수직응력은 1.2kPa, 중간지점의 초기수직응력은 0.6kPa이다. Fig. 22-23의 수평 점선은 흙기둥으로부터 계산된 흙기둥의 중간지점과 아래지점의 초기응력 값으로 입자법에서 계산된 값과 일치하는 것으로 확인되었다. 한편 입자법에서 응력 계산은 각 단면의 중앙지점을 기준으로 1.7cm만큼 떨어져 있는 주변 5개 입자의 응력값을 이용하여 평균하였다.

Time

0.0 sec

0.3 sec

0.6 sec

1.1 sec

Side view

http://static.apub.kr/journalsite/sites/kgs/2014-030-11/N0990301103/images/PIC11AE.gif

http://static.apub.kr/journalsite/sites/kgs/2014-030-11/N0990301103/images/PIC121C.gif

http://static.apub.kr/journalsite/sites/kgs/2014-030-11/N0990301103/images/PIC128B.gif

http://static.apub.kr/journalsite/sites/kgs/2014-030-11/N0990301103/images/PIC12DA.gif

Top view

http://static.apub.kr/journalsite/sites/kgs/2014-030-11/N0990301103/images/PIC13C5.gif

http://static.apub.kr/journalsite/sites/kgs/2014-030-11/N0990301103/images/PIC14E0.gif

http://static.apub.kr/journalsite/sites/kgs/2014-030-11/N0990301103/images/PIC188A.gif

http://static.apub.kr/journalsite/sites/kgs/2014-030-11/N0990301103/images/PIC1A50.gif

Fig. 21. Result of sand-clay column flow test with 80% water content and 50% sand content

http://static.apub.kr/journalsite/sites/kgs/2014-030-11/N0990301103/images/PIC1B7A.gifhttp://static.apub.kr/journalsite/sites/kgs/2014-030-11/N0990301103/images/PIC1C75.gif

Fig. 22. Variation of axial and shear stress on sandy-clay column flow test with 50% sand content and 40% water content

http://static.apub.kr/journalsite/sites/kgs/2014-030-11/N0990301103/images/PIC1E2C.gifhttp://static.apub.kr/journalsite/sites/kgs/2014-030-11/N0990301103/images/PIC1F46.gif

Fig. 23. Variation of axial and shear stress on sandy-clay column flow test with 50% sand content and 60% water content

한편 모래 함유량이 50%이면서 함수비가 80%인 경우 시료는 거의 점성이 낮은 유체와 같이 빠른 속도로 흘러 내려 전단응력이 거의 0에 가까운 값으로 예측되었다.

6. 결 론

본 연구에서는 모래질 점토의 함수비 증가에 따른 대변형을 시뮬레이션하기 위해 카올리나이트에 낙동강모래를 혼합하여 직경 7cm, 높이 13cm의 흙기둥을 제작하여 붕괴실험을 실시하였으며, 실험 결과를 MPS법에 기초한 입자법으로 시뮬레이션하였다. 카올리나이트에 모래 함유량을 0, 10, 25, 그리고 50%까지

증가시키면서 소성지수와 비배수전단강도를 측정하였으며, 이를 이용하여 입자법 수치해석에 필요한 입력변수를 결정하였다. 본 연구에서 얻은 결과를 정리하면 다음과 같다.

(1)기존 유체에 적용하기 위해 개발된 입자법인 MPS법에 유체와 고체 거동을 동시에 나타내는 흙과 같은 재료에 적용하기 위해 Mohr-Coulomb 파괴기준과 흙의 소성거동을 고려할 수 있는 계산 기능을 추가하였으며, 또한 기존 입자법 해석을 3차원으로 확장하였다.

(2)카올리나이트에 혼합된 모래 함유량이 증가함에 따라 흙의 소성지수와 비배수전단강도는 감소하였으며, 모래 함유량이 동일한 경우 함수비 증가에 따라 흙의 비배수전단강도는 감소하였다.

(3)동일한 모래 함유량에서 함수비가 증가할수록 변형이 크게 발생하였으며, 동일한 함수비라도 모래 함유량이 증가함에 따라 흙기둥의 변형은 크게 발생하였다. 최대 변형이 발생한 사례는 함수비 80%, 모래 함유량 50%인 경우로 직경 7cm의 흙기둥이 22cm까지 흘러 내렸다.

(4)흙의 소성전단계수를 흙의 비배수전단강도, 소성지수, 함수비에 따른 함수로 정의하여 이를 입자법 동점성계수와 연관지었다. 이와 같은 흙기둥 붕괴실험에서 관찰된 토사의 대변형 거동을 개발한 입자법의 점성항을 이용하여 비교적 잘 예측할 수 있었다.

(5)입자법에 의해 수직응력과 전단응력을 계산하였으며, 계산된 응력은 시간에 따른 토사 대변형으로 감소하는 경향을 보였다.

Acknowledgements

이 논문은 2014년도 정부(교육과학기술부)의 재원으로 한국연구재단의 기초연구사업 지원을 받아 수행되었으며(No. 2010-0023540), 일부는 2014년도 정부(미래창조과학부)의 재원으로 한국연구재단-공공복지안전연구사업의 지원을 받아 수행되었습니다(No. 2012M3A2A1050982).

References

1
1.Bui, H.H., Fukagawa, R., Sako, K., and Ohno, S. (2008), “Lagrangian meshfree particles method (SPH) for large deformation and failure flows of geomaterial using elastic-plastic soil constitutive model”, International Journal for Numerical and Analytical Methods in Geomechanics, Vol.32, pp.1537-1570.
2
2.Cundall, P. and Strack, O.D.L. (1979), “A discrete numerical model for granular assemblies,” Geotechnique, Vol.29, pp.47-65.
3
3.Itasca Consulting Group (2005), PFC3D (Particle Flow Code in 3 Dimensions).
4
4.Koshizuka, S., Tamako, H., and Oka, Y. (1995), “A particle method for incompressible viscous flow with fluid fragmentation”, Computational Fluid Dynamics Journal, 4, pp.29-46.
5
5.Maeda, K. and Sakai, M. (2004), “Development of seepage failure analysis procedure of granular ground with Smoothed Particle Hydrodynamics (SPH) method”, Journal of Applied Mechanics, JSCE, Vol.7, pp.775-786 (in Japanese).
6
6.Massarsch, K. R. (2004), “Deformation properties of fine-grained soils from seismic tests, International Conference on Site Characterization, ISC’2, 19-22 Sept. 2004, Porto, 14p.
7
7.Park, S.-S., Lee, D.-H., and Kwon, M.-H. (2013), “Development of numerical method for large deformation of soil using Particle method”, Journal of the Korean Geotechnical Society, Vol.29, No.12, pp.35-44.
8
Received : April 14th, 2014
9
Revised  : July 26th, 2014
10
Accepted : October 30th, 2014
페이지 상단으로 이동하기