


1. Introduction
The number of open cuts and underground excavations are increasing gradually due to the development and upgrading of existing and new infrastructure. The surrounding environment is often affected by these excavation works, which can cause several problems. In particular, a mis-calculation of the earth pressure on the excavation walls can result in collapse of the support systems in open cuts, which can lead to substantial time loss, financial damage, work stoppages, legal action, and compensation. On the other hand, an excessively conservative design of a retaining structure can add unnecessary cost to a project. Accordingly, the safety and economic considerations of the support systems are essential, for which it is important to understand the earth pressure acting against an excavation wall during the excavation process, together with the ground-wall interactions.


The earth pressure on the retaining walls caused by ground excavation works have been examined by several studies through experimental, analytical and numerical assessments (Peck, 1969; Bjerrum et al., 1972; Tschebotarioff, 1973; Lambe and Whitman, 1978; Potts and Fourie, 1986; Liao and Neff, 1990; Wong et al., 1997; Hashash and Whittle, 2002; Worden and Achmus, 2013). Most existing studies on the earth pressure focused mainly on the soil ground (sand and clay). Fig. 1 shows the apparent earth pressure envelopes suggested by Peck (1969) and Tschebotarioff (1973), which are used widely for the support systems in soil ground. The earth pressure from a faulted or jointed rock mass behind an excavation wall was assessed using the force polygon method for a wedge block, and Prakash and Saran (1966) suggested a method for calculating the earth pressure that makes use of the force equilibrium for a wedge block. This method, however, does not consider ground-wall interactions and cannot provide the distribution of the earth pressure along the wall.
Few studies have examined the rock strata to determine the earth pressure characteristics by considering the ground- wall interactions and joint characteristics, which are important parameters affecting the magnitude and distribution of earth pressure. This might be due to the general mis-conception that rock strata are under better conditions than soil ground. Recently, Son (2013), and Son and Park (2014) reported the results of the earth pressures in jointed rock masses. Their results clearly showed that the earth pressure can be higher for rock strata than soil ground when the rock and joint characteristics are under unfavorable conditions, such as a joint condition that induces sliding and a weathered joint and rock condition. On the other hand, the earth pressure might be much lower than the soil ground when the rock conditions are favorable.

This study extended the previous studies, focusing on the effects of the joint cohesive strength for different rock type and joint inclination angle. Numerical parametric studies were conducted by varying the joint cohesive strength together with the rock type and joint inclination angle. The advantages of numerical analysis are that various conditions can be considered easily with limited time, cost, and space, and reproducible analyses are possible. This characteristic allows the effects of rock and joint on the earth pressure to be investigated in various conditions. This study results are expected to provide a better under-standing of the earth pressure on the support system in a jointed rock mass and of appropriate measure to prevent a joint sliding in rock mass.
2. Numerical approach and parametric study
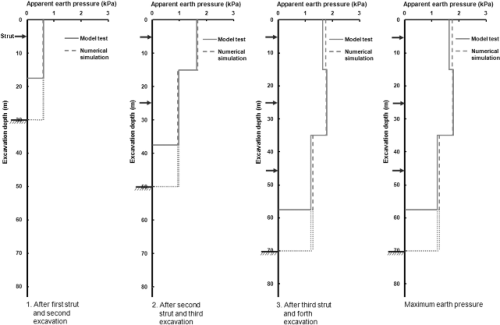
The numerical approach in this study is similar to the previous studies (Son, 2013 and Son and Park, 2014), and the following gives a brief description. The approach was verified by the numerical simulation of a physical model test (Figs. 2 and 3) and the details of the verification are reported elsewhere (Son and Park, 2014). The numerical approach was extended to this parametric study, which considered joint cohesive strength as well as rock type and joint inclination angle on the magnitude and distribution of earth pressure against the support systems in jointed rock masses.
The 2-D Universal Distinct Element Code (UDEC, 2004), which can allow large displacements between the blocks, was adopted. The rock blocks, wall and struts were simulated as separate elastic units. The joints between the rock blocks and the interfaces between the walls and rocks were modeled using the Coulomb slip model, in which when the contact shear stress exceeds the contact shear strength the contact loses its strength and sliding occurs.
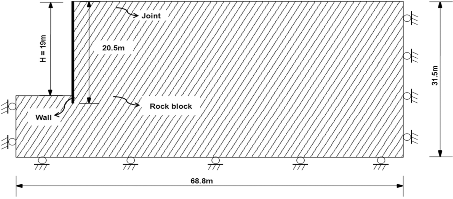
The analysis model for this study was 68.8 m × 31.5 m, and the excavation wall, which was a soldier pile and timber lagging wall, was installed to a depth of 20.5 m (Fig. 4). The excavation width was assumed to be 20 m and the final excavation depth was 19 m. A strut-supported system was used because the apparent earth pressure (Peck, 1969), which was compared with this study’s results, was obtained from many sets of comprehensive measurements of the strut-supported excavation walls.
|
Fig. 3. Comparison between the physical model test and numerical simulation (Son and Park, 2014) |
|
Fig. 4. Numerical modeling of single layered rock (joint inclination angle = 60°) |
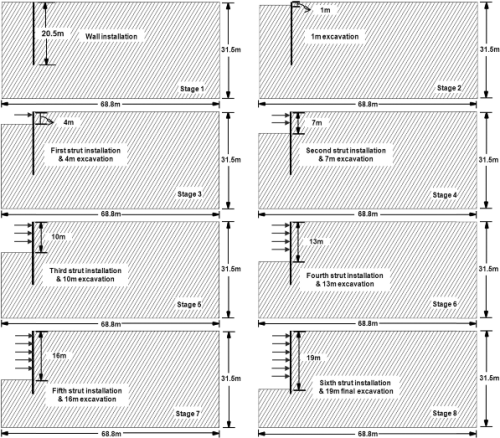
This study considered the various arrangements of rock type and joint condition (Table 1). The joint inclination angle was measured in the anticlockwise direction from the horizontal plane, and the joint spacing was assumed to be 1 m. To reflect the general excavation procedure in the field, eight stages of excavation were carried out to obtain the distribution and magnitude of the earth pressure. Before the first excavation, the initial equilibrium was obtained with an earth pressure coefficient of 0.5 at rest. At this stage, the boundary condition was a roller at each end of the two vertical boundaries and at the bottom boundary. After ensuring the initial equilibrium condition, all the displacements were reset to zero, and the wall was installed to a depth of 20.5 m. The first excavation was conducted up to 1.0 m, followed by installation of the first strut at 0.5 m over the excavation line. After the first excavation, additional excavation work was performed every 3 m, followed by strut installation every 3 m, which is 0.5 m above each excavation line. Wall stabilization was confirmed after each excavation stage. The final excavation was carried out up to 19.0 m, and the strut was not installed at the final stage (see Fig. 5).
Although the shape of a typical excavation wall (e.g. soldier pile and timber lagging wall) might have little effect on the earth pressure and displacement in the field, provided that flexural stiffness is equivalent, numerical analysis can have considerable effects on the result because of the stress composition in modeling. The shape of the actual wall was difficult to simulate identically by numerical analysis. To address this issue, this study transformed the excavation wall to a simple section representing the equivalent flexural stiffness of the wall (see Fig. 6). Table 2 lists the properties of the wall, rock, joint, and interface used in the numerical parametric studies.

 r
r = friction angle of joint or interface;
  r = residual friction angle of joint or interface; δ = friction angle of interface; kn = normal stiffness of joint or interface; ks = shear stiffness of joint or interface
3. Result analysis
The influence of joint cohesive strength on the magnitude and distribution of the earth pressure in jointed rock mass was examined, and the results of the investigation are discussed below.
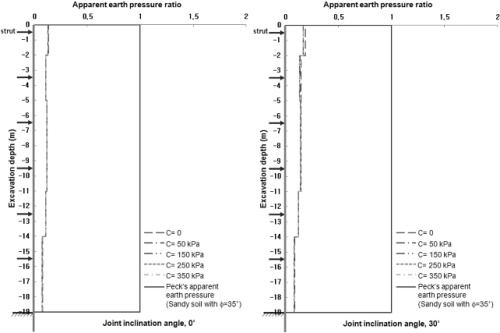
Fig. 7 compares the apparent earth pressures for hard rock due to the varying joint cohesion and joint inclination angle with Peck’s empirical earth pressure based on the sand ground with a friction of  = 35°. The apparent earth pressure ratio in the figure is the ratio of the induced earth pressure from the numerical test to Peck’s empirical earth pressure for the sand ground. Fig. 8 compares the total earth pressure ratios between the induced earth pressure from the numerical analysis and Peck’s empirical earth pressure for the sand ground.
For a joint inclination angle of 0°, the induced earth pressures for all levels of joint cohesion were very small and similar. The earth pressures were much lower than Peck’s earth pressure, and the total earth pressure ratio (the induced earth pressure/ Peck’s earth pressure) was only 0.01 for all levels of joint cohesion (see Fig. 8)
For a joint inclination angle of 30°, the induced earth pressures were similar to those of a joint inclination angle of 0°. The total earth pressure ratio was only 0.02 for all levels of joint cohesion.
For a joint inclination angle of 60°, where joint sliding was induced, the induced earth pressures were dependent on the joint cohesion. For the joint cohesion higher than 150 kPa, the earth pressure was very small and similar to those of the joint inclination angles of 0° and 30°. On the other hand, when the joint cohesion was lower than 50 kPa, the earth pressure increased significantly due to joint sliding. The total earth pressure ratio was only 0.02 for the joint cohesion higher than 150 kPa, but it increased to about 0.71 for the joint cohesion lower than 50 kPa.
For a joint inclination angle of 90°, the induced earth pressures were very small and similar regardless of the joint cohesion. The earth pressures were similar to those observed at joint inclination angles of 30°, and the total earth pressure ratio was only 0.02.
These results clearly indicated that the effect of joint cohesion on earth pressure was not considerable where there was no joint sliding, but it was significant when the joint inclination angle was under the condition of joint sliding. In addition, the results can be utilized to design a reinforcement system to prevent a joint sliding.

|
Fig. 8. Comparison of the total earth pressure between the numerical tests for hard rock and Peck’s empirical earth pressure |
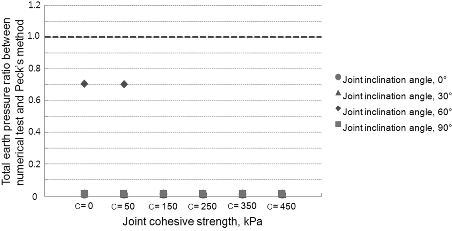
Fig. 9 compares the apparent earth pressures for slightly weathered rock due to the varying joint cohesion and joint inclination angle with Peck’s empirical earth pressure based on the sand ground with a friction of  = 35°. Fig. 10 compares the total earth pressure ratios between the induced earth pressure from the numerical analysis and Peck’s empirical earth pressure for the sand ground.
|
Fig. 9. Comparison of the apparent earth pressure ratio for slightly weathered rock (C = joint cohesive strength) (Continued) |
For a joint inclination angle of 0°, the induced earth pressures were similar regardless of the joint cohesion but the earth pressures were higher than those of hard rock with a joint inclination angle of 0°. The induced earth pressures were far lower than Peck’s earth pressure, and the total earth pressure ratio between the induced earth pressure and Peck’s earth pressure was 0.11 for all levels of joint cohesion (see Fig. 10).


For a joint inclination angle of 30°, the induced earth pressures were slightly higher than those with a joint inclination angle of 0°, but the earth pressures were similar for all the joint cohesion. The total earth pressure ratio was about 0.13 for all levels of joint cohesion.
For a joint inclination angle of 60°, the induced earth pressures showed a significant difference according to the joint cohesion. For the joint cohesion higher than 250 kPa, the induced earth pressures were very small and similar to those with joint inclination angles of 0° and 30°. On the other hand, when the joint cohesion was lower than 150 kPa, the earth pressure increased significantly due to joint sliding. The total earth pressure ratio was about 0.14 for the joint cohesion higher than 250 kPa, but it increased to about 0.8 for the joint cohesion lower than 150 kPa.
For a joint inclination angle of 90°, the induced earth pressures were similar to those of the joint inclination angles of 0° and 30°, even though the earth pressures were slightly higher. The total earth pressure ratio was 0.16 for all levels of joint cohesion.
As in hard rock, the results clearly indicated that the effect of joint cohesion on earth pressure was significant when the joint inclination angle was under the condition of joint sliding.
|
Fig. 11. Comparison of the apparent earth pressure ratio for moderately weathered rock (C = joint cohesive strength) (Continued) |

Fig. 11 compares the apparent earth pressures for moderately weathered rock due to the varying joint cohesion and joint inclination angles with Peck’s empirical earth pressure based on the sand ground with a friction of  = 35°. Fig. 12 shows the total earth pressure ratios between the induced earth pressure from the numerical analysis and Peck’s empirical earth pressure for the sand ground.
For a joint inclination angle of 0°, the induced earth pressures for all levels of joint cohesion were similar, but were considerably higher than those of hard and slightly weathered rock. The induced earth pressures were lower than Peck’s empirical earth pressure and the total earth pressure ratio was about 0.61.
For a joint inclination angle of 30°, the induced earth pressures were slightly higher than those with a joint inclination angle of 0°. The total earth pressure ratio was about 0.65.
For a joint inclination angle of 60°, the induced earth pressure was dependent on the magnitude of joint cohesion. A higher earth pressure was induced for the joint cohesion lower than 50 kPa, but the earth pressure decreased clearly at the joint cohesion higher than 150 kPa. When compared with hard and slightly weathered rocks under the same joint sliding condition, the induced earth pressure was higher than those of hard and slightly weathered rocks. The total earth pressure ratio was about 0.9 for the joint cohesion lower than 50 kPa and it decreased to about 0.69 for the joint cohesion higher than 150 kPa.


For a joint inclination angle of 90°, the induced earth pressure was similar to those with the joint inclination angles of 0° and 30°, but the induced earth pressure was slightly higher. When compared with a joint inclination angle of 60°, the induce earth pressures were similar for the joint cohesion higher than 150 kPa. The total earth pressure ratio decreased from 0.77 to 0.72 with increasing joint cohesion.
These results indicated that as the rock type became worsened the induced earth pressure increased significantly, but the effect of the joint cohesion and joint inclination angle was less significant.
4. Conclusions
The magnitude and distribution of the earth pressure on the support system in a jointed rock mass were examined by considering different joint shear strength, rock type, and joint inclination angle. The study particularly focused on the effect of joint cohesive strength. The following conclusions were drawn:
(1)This study clearly indicated that the effect of joint cohesion on earth pressure was not considerable where there was no joint sliding, but it was significant when the joint inclination angle was under the condition of joint sliding. The study investigated the magnitude of joint cohesive strength to prevent a joint sliding for each different condition. The results can be utilized for evaluating a joint sliding condition and designing a reinforcement system to prevent a joint sliding.
(2)For hard rock, the joint cohesion had little effect on the induced earth pressure at the joint inclination angles of 0°, 30° and 90°, where no joint sliding was induced, and the total earth pressure ratio (the induced earth pressure/ Peck’s earth pressure for soil ground) was only 0.02. However, for the joint inclination angle of 60°, where joint sliding was induced, the induced earth pressure was dependent on the joint cohesion and the total earth pressure ratio decreased from 0.71 for the joint cohesion lower than 50 kPa to 0.02 for the joint cohesion higher than 150 kPa.
(3)For slightly weathered rock, the effect of the joint cohesion was similar to that of hard rock, even though the induced earth pressure was higher than that of hard rock. The total earth pressure ratio was 0.11~0.16 for the joint inclination angles of 0°, 30° and 90°, where no joint sliding was induced. However, for the joint inclination angle of 60°, where joint sliding was induced, the total earth pressure ratio decreased from 0.8 for the joint cohesion lower than 150 kPa to 0.14 for the joint cohesion higher than 250 kPa.
(4)For moderately weathered rock, the induced earth pressure increased significantly compared to those of hard and slightly weathered rocks, regardless of the joint cohesion and joint inclination angle. The total earth pressure ratio was 0.61~0.77 for the joint inclination angles of 0°, 30° and 90°, where no joint sliding was induced. However, for the joint inclination angle of 60°, where joint sliding was induced, the total earth pressure ratio decreased from 0.9 for the joint cohesion lower than 50 kPa to 0.69 for the joint cohesion higher than 150 kPa.
(5)The magnitude and distribution of the earth pressure on the support system in a jointed rock mass were affected significantly by the joint cohesive strength as well as the rock type and joint inclination angle. The test results were also compared with Peck’s earth pressure, which has been frequently used for soil ground. The comparison indicated that the earth pressure in a jointed rock mass can be significantly different from that in soil ground. This study suggests that the magnitude and distribution of the earth pressure in a jointed rock mass should be assessed by considering rock and joint conditions together with rock-structure interaction.