Journal of the Korean Geotechnical Society. 31 July 2013. 17-36
https://doi.org/10.7843/kgs.2013.29.7.17

ABSTRACT


MAIN

  • 1. 서 론

  • 2. 현장 시험 개요

  •   2.1 M-대교 현장

  •   2.2 I-대교 연결도로 현장

  •   2.3 H-대교 현장

  •   2.4 I-tower project 현장

  • 3. 현장타설말뚝의 극한지지력 평가기준

  • 4. 주면 마찰력

  •   4.1 TCR(Total core recovery)

  •   4.2 변형 계수

  •   4.3 일축압축강도

  • 5. 선단 지지력

  •   5.1 TCR(Total core recovery)

  •   5.2 RQD(Rock quality designation)

  •   5.3 RMR(Rock mass rating)

  •   5.4 변형 계수

  •   5.5 일축압축강도

  • 6. 결 론

1. 서 론

최근 구조물의 크기가 대규모화 되어 감에 따라, 대용량 하중지지에 적합한 대구경 현장타설말뚝의 사용 빈도가 계속해서 늘어나고 있는 추세에 있다. 이러한 대구경 현장타설말뚝의 대부분이 암반 소켓말뚝으로 설계되고 있어서, 암반층에서의 주면마찰력과 선단지지력의 평가가 설계의 매우 중요한 요소가 되고 있다.

대구경 현장타설말뚝의 지지력 확인을 위하여 최근에는 양방향 말뚝재하시험(또는 O-cell 시험)이 많이 사용되고 있다. 양방향 재하시험은 기존의 정재하시험으로는 거의 불가능하였던 매우 큰 하중까지 재하가 가능하며 선단부 지지력과 주면마찰력의 분리측정이 가능하다(Osterberg, 1998; 2001). I-대교 연결도로 양방향 재하시험에서는 총 하중으로 환산시 최대 321MN까지 재하되었으며, I-타워 양방향 재하시험시에는 최대 362.2 MN까지 재하되었다(Song et al., 2006; Abdelrazaq et al., 2011). 이와 같이, 고용량 재하장치를 암반 속에 근입하여 시험하는 양방향 재하시험은 대구경 현장 타설말뚝의 극한 단위 주면마찰력과 선단 지지력을 직접 측정하기에 가장 적합한 시험 방법이다(Song et al., 2005; Kim, 2007).

http://static.apub.kr/journalsite/sites/kgs/2013-029-07/N0990290702/images/PIC5B76.gif

(a) Plan view

http://static.apub.kr/journalsite/sites/kgs/2013-029-07/N0990290702/images/PIC5D5B.gif

(b) Section views of piles for bidirectional load test and soil layer

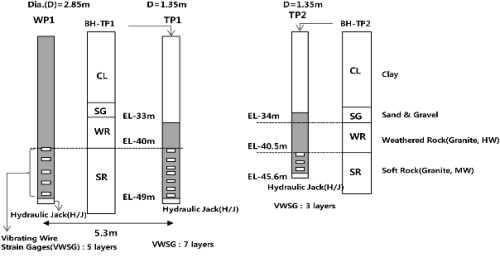
Fig. 1. Plan view and section view of piles for bidirectional load test at M-bridge site

양방향 말뚝재하시험은 시험대상 말뚝이 매우 길거나 단위 면적당 주면마찰력이 큰 암반층의 경우, 말뚝 내 두 개소 이상에 재하장치를 설치하여 말뚝의 지지력을 구간별로 나누어 시험할 수 도 있으며 다수의 반력말뚝 시공에 소요되는 비용 및 시간을 절감할 수 있는 장점이 있다(Song et al., 2006).

Table 1. Results of site investigation in each strain gage section

Project name

PileName

Diameter(m)

Test method

Elevation(EL-, m)

qu (avg) (MPa)

TCR

RQD

RMR

GSI

Dm(MPa)

M-BridgeProject

TP1

1.35

test pile

40.0~42.0

21.10

85.5

18

19.5

39

1906

TP1

1.35

test pile

42.0~43.0

18.00

100

27

26

43

-

TP1

1.35

test pile

43.0~44.0

22.67

93

15

23

41.5

-

TP1

1.35

test pile

44.0~45.0

33.20

93

15

20

40

1386

TP1

1.35

test pile

45.0~46.0

23.75

88

0

16.5

37.5

1386

TP1

1.35

test pile

46.0~47.0

12.40

88

0

13

35

-

TP1

1.35

test pile

47.0~48.0

20.20

100

9

18

38

-

TP2

1.35

test pile

41.0~43.0

57.56

76

0

19

40

-

TP2

1.35

test pile

43.0~44.0

85.30

87

12

23

45

-

TP2

1.35

test pile

44.0~44.7

41.50

87

12

28

45

-

WP1

2.85

working pile

40.0~42.0

21.10

85.5

18

19.5

39

1906

WP1

2.85

working pile

42.0~44.0

20.33

96.5

21

23

41.5

-

WP1

2.85

working pile

44.0~46.0

26.27

90.5

7.5

16.5

37.5

1386

WP1

2.85

working pile

46.0~48.0

17.60

94

4.5

15.5

39

-

WP1

2.85

working pile

48.0~48.65

25.60

100

9

19

39

-

I-Bridge AccesswayProject

TP1(ST2)

2.35

test pile

26.4~28.4

10.88

77

0

3

23.5

-

TP1(ST2)

2.35

test pile

28.4~30.4

12.89

75

0

3

26

2109

TP1(ST2)

2.35

test pile

30.4~31.4

13.82

96

0

3

30

-

TP1(ST2)

2.35

test pile

31.4~33.1

19.40

69

0

4

31.5

-

TP1(ST3)

2.35

test pile

26.4~28.4

10.88

77

0

3

23.5

-

TP1(ST3)

2.35

test pile

28.4~29.4

10.88

54

0

3

26

-

TP1(ST3)

2.35

test pile

29.4~30.4

14.90

96

0

3

30

2109

TP1(ST3)

2.35

test pile

30.4~33.1

16.61

82.5

0

4

31.5

-

TP2

1.85

test pile

29.1~31.0

20.47

85

63

33

58

-

TP2

1.85

test pile

31.0~32.0

13.87

53

22

28

52.5

-

TP2

1.85

test pile

32.0~34.0

17.54

53

22

23

47

-

TP3

1.35

test pile

25.0~26.1

12.48

80

58

35

57

388

TP3

1.35

test pile

26.1~27.1

14.66

80

58

35

57

-

TP3

1.35

test pile

27.1~28.1

22.30

80

58

35

57

4839

TP3

1.35

test pile

28.1~29.1

19.89

100

64

38

50

4839

TP3

1.35

test pile

29.1~31.2

22.31

100

64

38

50

4029

H-BridgeProject

PY1

1.85

working pile

59.94~62.39

34.19

100

20.5

22

51.5

-

PY2

1.85

working pile

60.70~62

-

65

0

3

25

-

P9

1.85

working pile

53.67~55.67

63.3

100

10

12

35

-

P19

2.35

working pile

35.16~36.66

-

48

14

15

20

-

P19

2.35

working pile

36.66~37.9

-

95

27

20

30

-

I-TowerProject

TP1

2.35

test pile

45.14~48.19

7.82

100

79

30

65

594

TP1

2.35

test pile

48.19~49.69

5.20

100

58

26

65

-

TP2

2.35

test pile

38.18~41.23

15.07

100

69

16

50

951.5

TP2

2.35

test pile

41.23~44.28

17.25

100

60

16

50

1385

TP2

2.35

test pile

44.28~45.78

28.85

100

56

21

49

-

TP4

2.35

test pile

40.99~42.04

18.00

97

53

26

57

1214

TP4

2.35

test pile

42.04~43.09

13.85

98.5

59

28.5

58.5

-

TP4

2.35

test pile

43.09~44.94

19.40

100

65

31

60

-

지금까지는 국내와 암반 조건이 다른 해외 문헌들에서 제안된 기존의 몇 가지 공식들을 이용하여 극한 지지력들을 계산하고 그 중 최저값을 적용하는 것이 보편적인 설계방법이었다. 그러나 최근 대용량 양방향 재하 시험 결과를 분석한 자료들에 의하면, 국내 암반에서 측정된 실제 지지력은 대체로 기존의 해외 문헌들에 제시된 값들보다 훨씬 큰 값을 나타내고 있다. 이에 본 연구에서는 최근 해상 교량기초 현장과 초고층 빌딩기초 현장에서 실시된 8개의 시험용 대구경 현장타설말뚝 재하시험결과와 5개의 본 말뚝 재하시험결과를 분석하여 각 현장 지반에서의 지지력 특성을 평가하고, 연암층에서의 설계 주면마찰력과 설계 선단지지력 산정식들을 다양한 변위기준에 대하여 제시하고자 한다.

Table 2. Results of site investigation in 2 diameter-depth section below the pile tip

Project name

PileName

Diameter(m)

Test method

Elevation(EL-, m)

qu (avg)(MPa)

TCR

RQD

RMR

GSI

Dm(MPa)

M-BridgeProject

TP1

1.35

test pile

48.94~51.64

32.94 

97.5

15.5

17.5

37.5

4387

TP2

1.35

test pile

45.6~48.3

44.90 

92

40

35.5

47.5

1352

WP1

2.85

working pile

49.6~55.3

35.88 

84

9.25

13.75

35.00

4387

I-Bridge AccesswayProject

TP1

2.35

test pile

33.36~38.06

19.42 

80

0

3

36.25

-

TP2

1.85

test pile

34.31~38.01

25.21 

100

70.5

41

59

-

TP3

1.35

test pile

31.51~34.21

39.23 

100

64

23

51

4029

H-BridgeProject

PY1

1.85

working pile

63.59~67.59

41.35 

100

39

28

55

-

PY2

1.85

working pile

63.2~67.2

20.08 

100

55

28

45

-

P9

1.85

working pile

56.22~60.22

26.62 

72.67

17.67

16.33

36.67

-

P19

2.35

working pile

38.76~43.46

-

71.5

20.5

17.5

25

-

I-TowerProject

TP1

2.35

test pile

33.36~38.06

19.42 

80

0

3

36.25

-

TP2

1.85

test pile

34.31~38.01

25.21 

100

70.5

41

59

-

TP3

1.35

test pile

31.51~34.21

39.23 

100

64

23

51

1762.5

2. 현장 시험 개요

2.1 M-대교 현장

M-대교 현장에서는 해상에서 소켓 직경 1.35m 의 시험용 말뚝 2본과 소켓 직경 2.85m의 본 말뚝에 대하여 양방향 재하시험을 실시하였다. 시험 대상 암반층은 화강암으로 구성되어있으며, 두 본의 시험용 말뚝에는 정 중앙 위치에서 시추와 지반 조사가 실시되었다. 말뚝 재하시험을 실시한 본 말뚝(사용말뚝)은 시험용 말뚝 TP1으로부터 5.3m 떨어진 위치에 시공되었으며 시험결과 분석을 위하여 TP1의 지반조사결과를 이용하였다. 현장의 기초평면도와 단면도 및 지반조사 주상도는 Fig. 1에 도시되어있다.

말뚝 길이방향의 구간별 f-w 곡선(변위에 따른 단위 주면마찰력 관계곡선) 작성을 위한 변형율계들이 설치된 각 구간에서 직접 측정한 평균일축압축강도, Total Core Recovery(TCR), Rock Quality Designation(RQD), Rock Mass Rating(RMR), Geological Strength Index(GSI)와 공내재하시험으로 얻은 변형계수(Dm) 값들이 Table 1에 기타 현장 자료들과 함께 요약되어 있다. 또한, 변위에 따른 단위 선단 지지력의 관계를 나타내는 q-w 곡선의 분석을 위하여 선단 아래 말뚝 직경(D)의 2배 구간에서 조사된 지반 특성 자료들은 Table 2에 요약되어 있다.

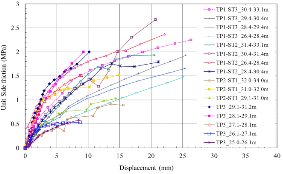
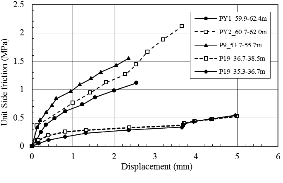
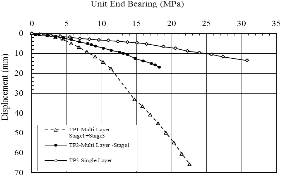
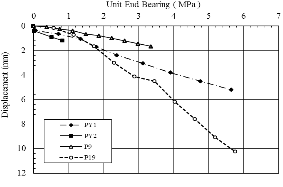
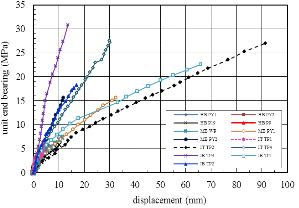
양방향 재하시험 결과는 본 연구에서 실시한 기타 현장시험결과들과 함께 Table 3에 요약되어 있다. 또한 양방향 재하시험 결과로부터 얻어진 각 말뚝의 구간별 f-w 곡선과 q-w 곡선이 각각 Fig. 5의 (a)와 6의 (a)에 도시되어있다.

2.2 I-대교 연결도로 현장

I-대교 연결도로 현장에서는 연암의 주면마찰력과 선단지지력 특성 파악을 위하여 총 3본의 시험말뚝에서 양방향 재하시험이 실시되었다. 2본의 시험말뚝(소켓직경 1.85m, 2.35m)에는 가압 셀을 두 군데에 위치시켜 말뚝 한 본을 이용하여 두 개의 말뚝을 시험한 것과 같은 결과를 도출할 수 있는 다단(Multi-level) 양방향 재하시험(Song et al., 2006)을 적용하였으며, 소켓직경 1.35m 시험말뚝에는 1단 양방향 재하시험을 실시하였다. 재하시험용 말뚝의 단면도와 주상도는 Fig. 2에 도시되어있다.

시험 대상 지반의 기반암은 화강암과 화강편마암으로 이루어져 있으며, 각 말뚝의 정 중앙에서 수행한 시추 조사 결과 및 각 구간별 시험 결과는 Table 1에 요약되어 있다. 다단 양방향 재하시험을 이용하면 다단 셀 사이의 주면마찰력은 실제 하중 작용방향인 하향방향과 일반적인 양방향시험의 하중방향인 상향방향으로 모두 측정할 수가 있다. 암반의 경우 상/하향 변위 방향에 따른 지지거동의 차이는 크지 않은 것으로 평가되고 있으므로, 한 방향 가압에 의하여 주면마찰력이 항복상태에 도달하지 않은 경우에는 양방향의 데이터를 주면마찰력 분석에 같이 사용할 수가 있다. 따라서, TP1 시험말뚝은 상향방향(하단 가압장치 가압)과 하향방향(상단 가압장치 가압)의 재하시험 결과를 모두 분석에 이용하였다.
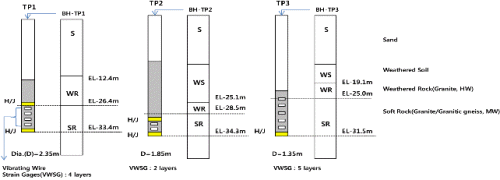
Table 3. Results of bidirectional load tests

Project

name

Pile

Loading Stage1)

Nominal diameter

(mm)

The number of f-w curves in soft rock

Max. load in one direction

(MN)

Displacement

(mm)

Pressurized load

(MPa)

Load

per pile

(MN)

Up-

ward

Down-

ward

scheduled

measured

M-BridgeProject

TP1

Single

1350

7

7

23.03

5.64

32.47

16.1

46.06

TP2

Single

1350

3

3

23.03

5.59

11.78

16.1

46.06

WP1

Single

2850

5

5

47.04

2.04

11.15

7.38

94.08

I-Bridge AccesswayProject

TP1

Stage1(L) 

2350

5

8(4)2)

86.6

3.57

24.76

20.0

321

Stage2(U)

109.6

103.6

22.51

25.3

Stage3(L)

101.9

27.15

48.35

23.5

TP2

Stage1(L)

1850

3

3

51.0

16.06

17.02

19.0

117.9

Stage2(U)

15.9

88.92

2.5

5.9

TP3

Single

1350

5

5

45.9

10.87

13.55

32.1

91.7

H-BridgeProject

PY1

Single

1850

3

1

24.86

2.56

5.19

9.24

49.72

PY2

Single

1850

1

1

30.08

17.20

3.83

11.20

60.16

P9

Single

1850

1

1

24.89

2.50

1.60

9.26

49.78

P19

Single

2350

3

2

24.53

5.02

10.30

5.66

49.06

I-TowerProject

TP1

Stage1(U)

2350

4

2

101.9

40.35

41.24

23.5

362.2

Stage2(L)

93.7

30.82

116.50

21.6

Stage3(U)

134.4

71.88

38.66

31.0

TP2

Stage1(U)

2350

5

3

108.6

61.76

19.31

25.1

342.3

Stage2(L)

125.1

46.87

91.30

28.9

TP4

Stage1(L)

2350

4

3

104.1

31.11

25.75

24.0

314.6

Stage2(U)

62.8

89.77

4.62

14.5

Stage3(L)

125.9

114.46

30.10

29.0

1) Loading stage and location of pressurized cell : U-upper cell, L-lower cell

2) Total 8 data : 4 data from Stage 1 upward loading and 4 data from Stage 2 downward loading

http://static.apub.kr/journalsite/sites/kgs/2013-029-07/N0990290702/images/PIC6099.gif

Fig. 2. Section views of piles for bidirectional load test and soil layer at I-bridge accessway site

http://static.apub.kr/journalsite/sites/kgs/2013-029-07/N0990290702/images/PIC6155.gif

                                   (a) PY1                                 (b) PY2

http://static.apub.kr/journalsite/sites/kgs/2013-029-07/N0990290702/images/PIC6231.gif

                                (c) P9                                      (d) P19

Fig. 3. Section views of piles for bidirectional load test and soil layer at H-bridge site

본 재하시험에서는 2개의 시험말뚝이 상향으로 파괴가 발생하여 극한 주면마찰력을 측정할 수가 있었다. Fig. 5의 (b)와 6의 (b)에는 시험말뚝에 설치한 변형율계로 측정한 응력값을 분석하여 작성한 f-w 곡선과 q-w곡선이 도시되어 있다.

2.3 H-대교 현장

H-대교 현장의 기반암은 화강암으로 구성되어 있으며 총 4본(말뚝의 소켓 직경은 1.85m 3본과 2.35m 한 본)의 사용 말뚝에 대한 재하시험이 실시되었다. 재하시험용 말뚝의 단면도와 주상도는 Fig. 3에 도시되어있다. 사용말뚝의 경우에는 말뚝 정 중앙 위치가 아니라 인접한 위치에서 지반조사가 실시되었으며, 시험말뚝 대비 자세한 지반 조사와 시험이 실시되지는 못하였다. Table 1에서와 같이 2개의 f-w 곡선에 해당되는 구간에서 일축압축강도 시험이 실시되었으며, Table 2의 q-w 곡선 분석을 위한 데이터에서도 3본(PY1, PY2, P9)의 말뚝 선단에서 일축압축강도 시험이 실시되었다. Fig. 5의 (c)와 6의 (c)에는 사용말뚝에 설치한 변형율계로 측정한 f-w 곡선과 q-w곡선이 도시되어있다.

2.4 I-tower project 현장

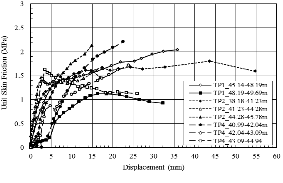
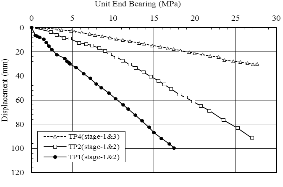
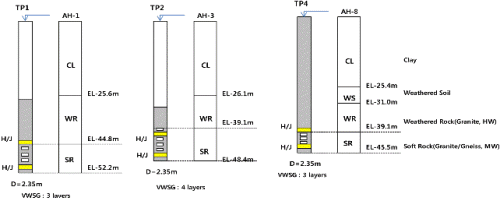
I-tower project 현장은 화강암과 화강편마암으로 구성되어 있으며 소켓 직경 2.35m의 시험말뚝 4본을 시공하였으나 시공 중 문제가 된 말뚝을 제외하고 3본의 말뚝을 분석에 적용하였다. 재하시험용 말뚝의 단면도와 주상도는 Fig. 4에 도시되어있다. 모든 시험말뚝에 가압 셀을 두 군데에 위치시켜 말뚝 한 본을 이용하여 두 개의 말뚝을 시험한 것처럼 다양한 심도에 따른 극한 단위 주면마찰력을 측정할 수 있는 다단(Multi-level) 양방향 재하시험법을 적용하였다.
http://static.apub.kr/journalsite/sites/kgs/2013-029-07/N0990290702/images/PIC62ED.gif

               (a) TP1                             (b) TP2                                            (c) TP4

Fig. 4. Section views of piles for bidirectional load test and soil layer at I-tower site

http://static.apub.kr/journalsite/sites/kgs/2013-029-07/N0990290702/images/PIC632D.gif

http://static.apub.kr/journalsite/sites/kgs/2013-029-07/N0990290702/images/PIC637C.gif

(a) f-w curves at M-bridge

(b) f-w curves at I-bridge accessway

http://static.apub.kr/journalsite/sites/kgs/2013-029-07/N0990290702/images/PIC63BB.gif

http://static.apub.kr/journalsite/sites/kgs/2013-029-07/N0990290702/images/PIC641A.gif

(c) f-w curves at H-bridge

(d) f-w curves at I-Tower

Fig. 5. Measured f-w curves in soft rock

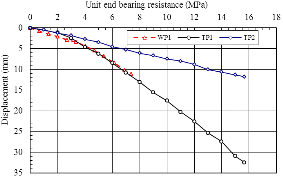
시추조사와 지반조사는 모두 시험말뚝의 정 중앙에서 실시되었으며 각 구간별 지반조사 결과는 Table 1에 요약되어 있다. 측정된 f-w 곡선과 q-w곡선은 Fig. 5의 (d)와 6의 (d)와 같다.

3. 현장타설말뚝의 극한지지력 평가기준
http://static.apub.kr/journalsite/sites/kgs/2013-029-07/N0990290702/images/PIC645A.gif

http://static.apub.kr/journalsite/sites/kgs/2013-029-07/N0990290702/images/PIC6499.gif

(a) q-w curves at M-bridge

(b) q-w curves at I-bridge accessway

http://static.apub.kr/journalsite/sites/kgs/2013-029-07/N0990290702/images/PIC64D9.gif

http://static.apub.kr/journalsite/sites/kgs/2013-029-07/N0990290702/images/PIC6518.gif

(c) q-w curves at H-bridge

(d) q-w curves at I-tower

Fig. 6. Measured q-w curves in soft rock

http://static.apub.kr/journalsite/sites/kgs/2013-029-07/N0990290702/images/PIC6577.gif

http://static.apub.kr/journalsite/sites/kgs/2013-029-07/N0990290702/images/PIC65B6.gif

Fig. 7. 44 measured f-w curves from 13 bidirectional load tests

Fig. 8. 13 measured q-w curves from 13 bidirectional load tests

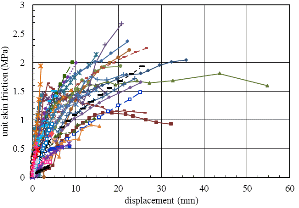
이상에서 소개한 4개 현장에서 실시된 13본의 양방향 재하시험 결과로부터 44개의 f-w 곡선과 13개의 q-w 곡선을 작성하였다. 이 44개의 f-w 곡선들은 Fig. 7에 도시되어 있으며 시험 시 발생한 최대변위가 0.9mm에서 54.7mm이다. Fig. 8에는 측정된 13개의 q-w 곡선들이 도시되어 있으며 시험 시 발생된 최대변위는 1.2mm에서 99.6mm이다. 이와 같이 측정된 지지력 데이터들의 발생 변위가 다양하고, 또한 극한까지 도달하지 못하였거나 변형 경화(strain-hardening) 경향을 보여 주는 지지력 데이터의 분석을 위해서 발생 변위에 따른 지지력 분석을 수행하였다.

극한지지력 평가를 위한 변위기준에 대한 문헌조사내용을 Table 4에 요약하였다. Table 4에서 보듯이 극한 지지력의 기준변위는 각 연구자들과 암반 조건 및 강도의 종류 등에 따라 매우 다양하다. 주면마찰력의 경우 5mm 부터 직경의 1%까지의 범위에 존재하며 선단지지력의 경우 10mm부터 직경의 5%까지 다양한 범위로 존재한다. 일반적으로 국내의 연암 조건에서는 직경의 5%까지 변위를 발생시키는 것은 거의 불가능하다. 따라서, Table 4의 변위 기준을 참고하여 국내의 암반조건에 적합한 5mm, 10mm, 25.4mm와 직경의 1% 변위 기준에 대하여 주면 마찰력과 선단 지지력에 대한 분석을 수행하였다.

4. 주면 마찰력

단위 주면 마찰력과 TCR, RQD, RMR, GSI, 변형계수 및 일축압축강도들과의 정확한 상관 관계 분석을 위하여, Fig. 1~4에 도시된 것과 같이 변형율계가 설치된 구간의 데이터(Table 1)를 상관관계 분석에 사용하였다.
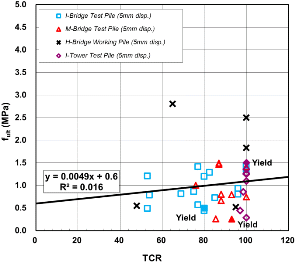
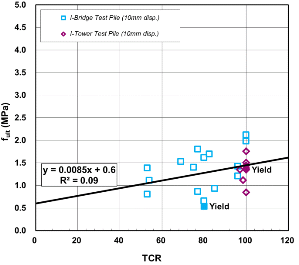
Table 4. Fully mobilized displacement criteria for drilled shaft

Skin Friction

Williams et al. (1980)

6 mm or 0.9% of Diameter (D)

Fleming et al. (1985)

0.5~2% of Diameter (D)

CGS (1995), Kulhawy (1984)

5~10 mm

Reese and O’Neil (1988)

10 mm

ASCE 20-96 (1997)

1% of Diameter (D)

O’Neil and Reese (1999)

0.2~0.8% of Diameter or 0.1~1% of Diameter (D)

Ng et al. (2001)

4 mm or 0.4% of Diameter (D)

KSCE (2001)

10 mm

GEO (2006)

1% of Diameter (D)

AASHTO LRFD (2007)

10 mm

FHWA (2010)

12.7 mm (0.5 in)

End bearing

Peck et al. (1974)

12.7 mm (0.5 in)

O’Neil and Reese (1999)

5% of Diameter (D)

AASHTO LRFD (2007)

5% of Diameter (D)

HK CP BD (2004)

25 mm

FHWA (2010)

4~5% of Diameter (D)

http://static.apub.kr/journalsite/sites/kgs/2013-029-07/N0990290702/images/PIC6644.gif

http://static.apub.kr/journalsite/sites/kgs/2013-029-07/N0990290702/images/PIC66E1.gif

(a) 5 mm displacement

(b) 10 mm displacement

Fig. 9. Empirical relations between maximum mobilized unit skin friction and TCR depending on mobilized displacement

4.1 TCR(Total core recovery)

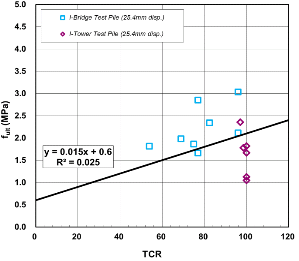
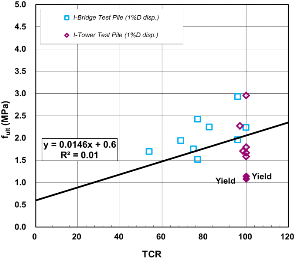
44개의 f-w 곡선과 각 해당 심도에서의 TCR, RQD, RMR, GSI 등 암반 분류 및 평가법과의 상관 관계를 분석한 결과, TCR 값과는 상관계수가 0.1 미만으로 아주 약간 상관성을 보여주었으나 다른 암반 평가법들과는 상관성이 전혀 없는 것으로 나타났다. 변위에 따른 TCR과 단위 주면 마찰력의 선형 상관관계 그래프는 Fig. 9에 굵은 실선으로 도시되어있다(Fig. 9에서 항복점이 나타난 경우에는 항복(yield)으로 표기를 하였다).
http://static.apub.kr/journalsite/sites/kgs/2013-029-07/N0990290702/images/PIC677F.gif

http://static.apub.kr/journalsite/sites/kgs/2013-029-07/N0990290702/images/PIC67ED.gif

(c) 25.4 mm displacement

(d) 1% of diameter displacement

Fig. 9. Empirical relations between maximum mobilized unit skin friction and TCR depending on mobilized displacement (Continued)

http://static.apub.kr/journalsite/sites/kgs/2013-029-07/N0990290702/images/PIC689A.gif

http://static.apub.kr/journalsite/sites/kgs/2013-029-07/N0990290702/images/PIC6918.gif

(a) 5 mm displacement

(b) 10 mm displacement

http://static.apub.kr/journalsite/sites/kgs/2013-029-07/N0990290702/images/PIC6996.gif

http://static.apub.kr/journalsite/sites/kgs/2013-029-07/N0990290702/images/PIC69E5.gif

(c) 25.4 mm displacement

(d) 1% of diameter displacement

Fig. 10. Empirical relations between maximum mobilized unit skin friction and deformation modulus depending on mobilized displacement

4.2 변형 계수

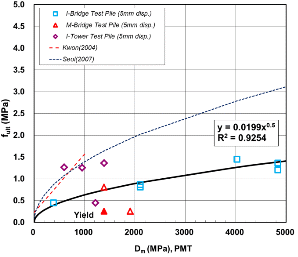
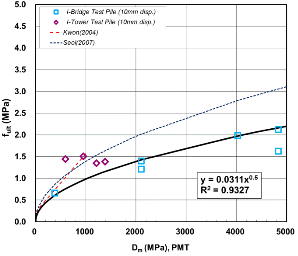
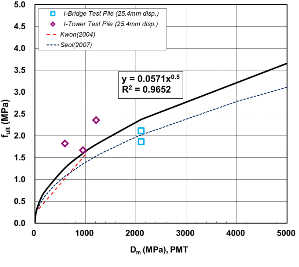
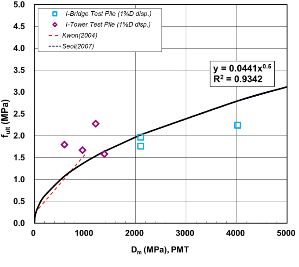
공내재하시험에서 산정한 변형계수와 변위에 따른 주면마찰력과의 상관관계를 Fig. 10에 Kwon(2004)과 Seol(2007)의 연구 결과와 함께 도시하였다. 직경의 1% 변위에 해당되는 주면 마찰력(Fig. 10의 (d))에서는 기존 연구자들과 일치하는 결과가 나타났으며 이는 유사한 암반 조건 및 발생 변위에 기인하는 것으로 판단된다. 변형계수를 이용한 주면 마찰력 산정식은 Table 5에 요약되어 있다.

4.3 일축압축강도

Table 5. Developed empirical relations using deformation modulus and compressive strength of rock core

Mobilized Displacement

(mm)

Empirical equation (MPa)

Deformation Modulus (MPa)

Compressive Strength (MPa)

5

http://static.apub.kr/journalsite/sites/kgs/2013-029-07/N0990290702/images/PIC6A24.gif

http://static.apub.kr/journalsite/sites/kgs/2013-029-07/N0990290702/images/PIC6A35.gif

10

http://static.apub.kr/journalsite/sites/kgs/2013-029-07/N0990290702/images/PIC6A46.gif

http://static.apub.kr/journalsite/sites/kgs/2013-029-07/N0990290702/images/PIC6A56.gif

25.4

http://static.apub.kr/journalsite/sites/kgs/2013-029-07/N0990290702/images/PIC6A77.gif

http://static.apub.kr/journalsite/sites/kgs/2013-029-07/N0990290702/images/PIC6A87.gif

1% of diameter

http://static.apub.kr/journalsite/sites/kgs/2013-029-07/N0990290702/images/PIC6AA7.gif

http://static.apub.kr/journalsite/sites/kgs/2013-029-07/N0990290702/images/PIC6AB8.gif

http://static.apub.kr/journalsite/sites/kgs/2013-029-07/N0990290702/images/PIC6B55.gif

http://static.apub.kr/journalsite/sites/kgs/2013-029-07/N0990290702/images/PIC6C21.gif

(a) 5 mm displacement

(b) 10 mm displacement

Fig. 11. Empirical relations between maximum mobilized unit skin friction and unconfined compressive strength depending on mobilized displacement

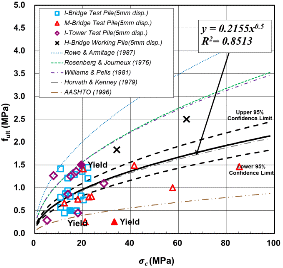
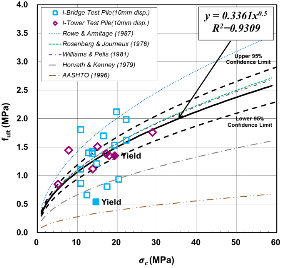
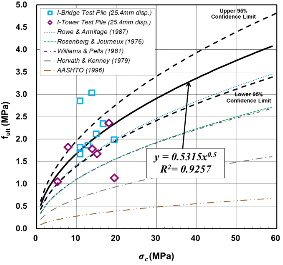
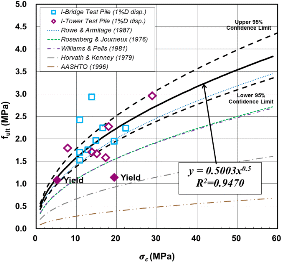
지지력 분석을 위한 암석코어의 강도는 변형율계 설치 위치에 따라 구간을 나누고 각 구간에 해당하는 깊이에서의 일축압축시험 결과를 평균하여 산정하였으며, 해당 구간에 대한 일축압축시험 결과가 없는 경우에는 지지력 분석에서 제외하였다. 변위에 따른 암석의 일축압축강도(σc)와 주면마찰력과의 상관관계는 Fig. 11에 기존의 연구 결과와 함께 도시하였으며 상관 관계식은 Table 5에 요약되어 있다.

Fig. 11(a)의 5mm 변위에 해당하는 단위 주면마찰력의 경우, 세 측점에서 항복이 발생하였으며 전체적인 경향은 Horvath & Kenney(1979)의 주면 마찰력 제안식과 유사한 것으로 나타났다. Fig. 11(b)의 10mm 변위에 해당하는 단위 주면마찰력의 경우, 두 측점에서 항복이 발생하였으나 전체적인 경향은 Rosenberg & Journeux(1976)와 Williams & Pells(1981)의 주면 마찰력 제안식과 비교적 잘 일치하는 것으로 판단된다. Fig. 11(c)와 (d)에는 각각 25.4mm 변위와 직경의 1% 변위(13.5mm~23.5mm)에서 산정한 단위 주면마찰력을 나타내었으며, 시험 결과는 Rowe & Armitage(1987)의 주면 마찰력 공식보다 다소 큰 것으로 나타났다.

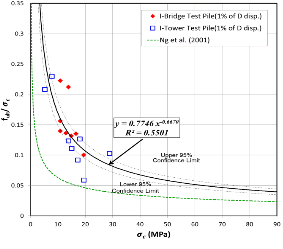
일축압축강도로 정규화된 단위 주면마찰력과 일축압축강도와의 상관관계는 Ng et al.(2001)이 홍콩과 싱가포르의 화강암에 대하여 수행한 연구결과와 함께 Fig. 12에 비교 도시하였다. Fig. 12로부터 일축압축강도가 증가함에 따라 일축압축강도로 정규화된 주면 마찰력이 급격하게 감소하는 것을 알 수 있다. Fig. 12(a)의 5mm 변위에 대한 결과는 Ng et al.(2001)의 연구결과와 상당히 유사한 것으로 나타났으며 발생변위가 증가할수록 본 연구결과의 값이 더 커지는 것을 알 수가 있다. 이는 Ng et al.(2001)의 연구보다 더 큰 하중으로 재하시험이 실시되었고, 상대적으로 큰 변위를 유발하였기 때문으로 판단된다.
http://static.apub.kr/journalsite/sites/kgs/2013-029-07/N0990290702/images/PIC6CDE.gif

http://static.apub.kr/journalsite/sites/kgs/2013-029-07/N0990290702/images/PIC6D9A.gif

(c) 25.4 mm displacement

(d) 1% of diameter displacement

Fig. 11. Empirical relations between maximum mobilized unit skin friction and unconfined compressive strength depending on mobilized displacement (Continued)

http://static.apub.kr/journalsite/sites/kgs/2013-029-07/N0990290702/images/PIC6EB5.gif

http://static.apub.kr/journalsite/sites/kgs/2013-029-07/N0990290702/images/PIC6F33.gif

(a) 5 mm displacement

(b) 10 mm displacement

http://static.apub.kr/journalsite/sites/kgs/2013-029-07/N0990290702/images/PIC6FA1.gif

http://static.apub.kr/journalsite/sites/kgs/2013-029-07/N0990290702/images/PIC7000.gif

(c) 25.4 mm displacement

(d) 1% of diameter displacement

Fig. 12. Maximum mobilized unit skin friction normalized by unconfined compressive strength versus unconfined compressive strength depending on mobilized displacement

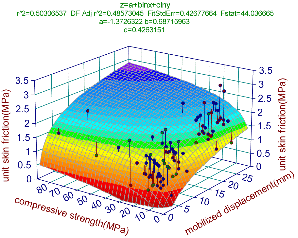
전체 변위구간에 대하여 주면마찰력과의 상관관계를 도출하기 위하여 Fig. 11과 Table 5에 나타낸 일축압축강도와 단위 주면마찰력의 데이터를 이용하여 3차원 회귀분석(다중 회귀분석)을 실시하였으며 그 결과는 Fig. 13 및 Eq. (1)과 같다.
http://static.apub.kr/journalsite/sites/kgs/2013-029-07/N0990290702/images/PIC7139.gif

Fig. 13. Multiple regression analysis using skin friction, compressive strength and displacement

fult=-1.37+0.687・lnδ+0.426lnσc,R2=0.503 (1)

여기서, 

fult : 최대 단위 주면마찰력(MPa)

δ  : 발생 변위(mm)

σc : 암석의 일축압축강도(MPa)

http://static.apub.kr/journalsite/sites/kgs/2013-029-07/N0990290702/images/PIC71A8.gif

http://static.apub.kr/journalsite/sites/kgs/2013-029-07/N0990290702/images/PIC71F7.gif

(a) 5 mm displacement

(b) 10 mm displacement

Fig. 14. Empirical relations between maximum mobilized unit end bearing capacity and TCR depending on mobilized displacement

R2 : 결정계수(상관계수)

다중 회귀분석의 결정계수는 0.503으로 주면마찰력, 압축강도 및 발생변위가 서로 유의한 관계에 있음을 알 수 있다. Eq. (1)의 적용을 위한 최대 변위의 한계는 약 25.4mm이다.

5. 선단 지지력

단위 선단지지력과 Table 2에 도시된 TCR, RQD, RMR, GSI, 변형계수 및 일축압축강도와의 상관 관계 분석을 위하여, 각 시험말뚝의 선단 아래 2D 구간에서의 평균값을 이용하여 분석하였다.

5.1 TCR(Total core recovery)

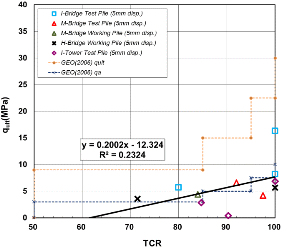
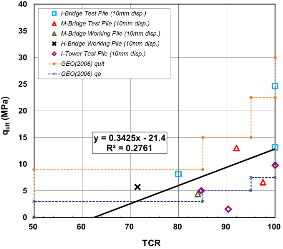
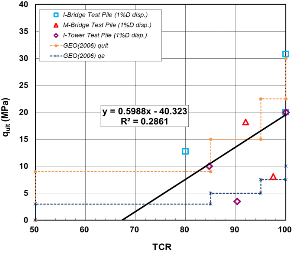
13개의 q-w 곡선을 이용하여 발생변위에 따른 TCR과 단위 선단지지력의 상관관계 분석을 실시하였으며 그 결과를 Fig. 14에 홍콩 GEO(2006)에서 제안한 추정 선단지지력 공식과 함께 굵은 실선으로 도시하였다. 5mm 변위에서는 GEO(2006) 방법의 허용 지지력(안전율 3 적용)과 유사한 결과가 도출되었으며, 25.4mm와 직경의 1%에 해당하는 변위에서는 GEO(2006) 방법의 극한 지지력과 유사한 것으로 나타났다.

http://static.apub.kr/journalsite/sites/kgs/2013-029-07/N0990290702/images/PIC72F2.gif

http://static.apub.kr/journalsite/sites/kgs/2013-029-07/N0990290702/images/PIC79C9.gif

(c) 25.4 mm displacement

(d) 1% of diameter displacement

Fig. 14. Empirical relations between maximum mobilized unit end bearing capacity and TCR depending on mobilized displacement (Continued)

http://static.apub.kr/journalsite/sites/kgs/2013-029-07/N0990290702/images/PIC7AA5.gif

http://static.apub.kr/journalsite/sites/kgs/2013-029-07/N0990290702/images/PIC7BAF.gif

(a) 5 mm displacement

(b) 10 mm displacement

http://static.apub.kr/journalsite/sites/kgs/2013-029-07/N0990290702/images/PIC7C6C.gif

http://static.apub.kr/journalsite/sites/kgs/2013-029-07/N0990290702/images/PIC7D28.gif

(c) 25.4 mm displacement

(d) 1% of diameter displacement

Fig. 15. Empirical relations between maximum mobilized unit end bearing capacity and RQD depending on mobilized displacement

5.2 RQD(Rock quality designation)
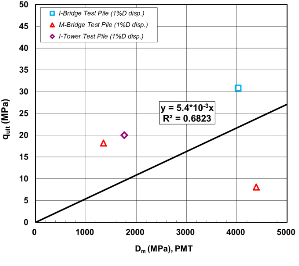
http://static.apub.kr/journalsite/sites/kgs/2013-029-07/N0990290702/images/PIC7DC5.gif

http://static.apub.kr/journalsite/sites/kgs/2013-029-07/N0990290702/images/PIC7E53.gif

(a) 5 mm displacement

(b) 10 mm displacement

http://static.apub.kr/journalsite/sites/kgs/2013-029-07/N0990290702/images/PIC7EA2.gif

http://static.apub.kr/journalsite/sites/kgs/2013-029-07/N0990290702/images/PIC800B.gif

(c) 25.4 mm displacement

(d) 1% of diameter displacement

Fig. 16. Empirical relations between maximum mobilized unit end bearing capacity and RMR depending on mobilized displacement

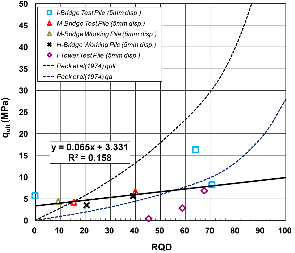
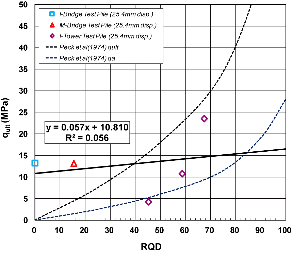
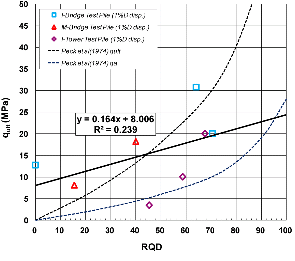
RQD와 변위에 따른 단위 선단지지력의 상관관계 분석을 실시한 결과를 Fig. 15에 도시하였다. Fig. 15에는 측정된 데이터와 Peck et al.(1974)의 경험식을 극한지지력과 허용지지력(안전율 3 적용)으로 구분하여 비교하였다. 변위가 10mm 이상 증가함에 따라 측정된 데이터는 Peck et al.(1974)의 허용지지력과 극한지지력 사이에 존재하며, RQD 20 이하에서도 지지력이 감소하지않고 일정한 값을 나타내었다. 변위가 직경의 1%일 경우 가장 상관관계가 좋았으며 Peck et al.(1974)의 결과와 유사한 경향을 보이는 것으로 나타났다.

5.3 RMR(Rock mass rating)

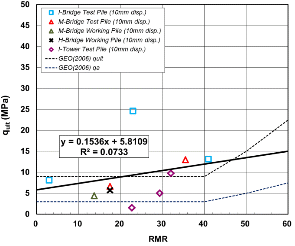
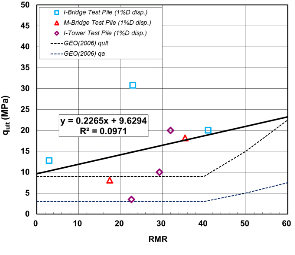
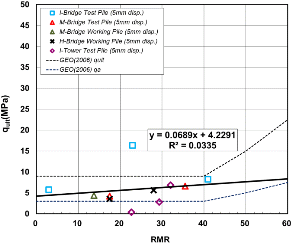
RMR과 변위에 따른 단위 선단지지력의 상관관계 분석을 실시한 결과를 Fig. 16에 홍콩 GEO(2006)에서 제안한 식과 함께 도시하였다. 5, 10mm 변위에서는 홍콩 GEO(2006) 방법의 지지력과 유사한 것으로 나타났다.

5.4 변형 계수

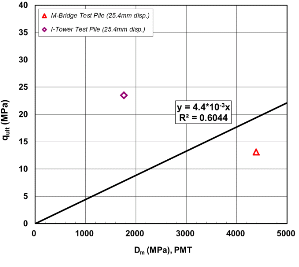
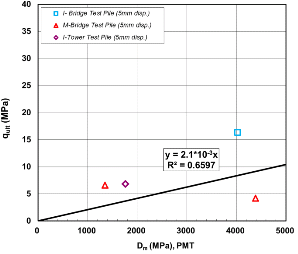
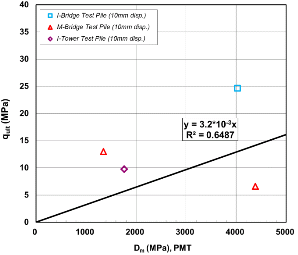
변형계수와 변위에 따른 단위 선단지지력의 상관관계는 Fig. 17과 같다. 그러나, 해당되는 위치에서의 공내재하시험 데이터의 수가 매우 작은 관계로 본 결과의 실무적용은 불가능하다.
http://static.apub.kr/journalsite/sites/kgs/2013-029-07/N0990290702/images/PIC80B7.gif

http://static.apub.kr/journalsite/sites/kgs/2013-029-07/N0990290702/images/PIC8145.gif

(a) 5 mm displacement

(b) 10 mm displacement

http://static.apub.kr/journalsite/sites/kgs/2013-029-07/N0990290702/images/PIC8194.gif

http://static.apub.kr/journalsite/sites/kgs/2013-029-07/N0990290702/images/PIC8203.gif

(c) 25.4 mm displacement

(d) 1% of diameter displacement

Fig. 17. Empirical relations between maximum mobilized unit end bearing capacity and deformation modulus depending on mobilized displacement

5.5 일축압축강도

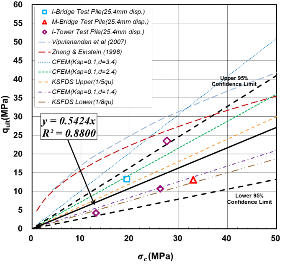
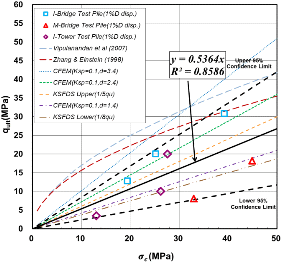
일축압축강도는 기존의 여러 경험식들에서 사용된 바와 같이 암반 소켓 말뚝의 선단 지지력을 결정하는 아주 중요한 요소로 알려져 있는데 본 연구결과에서도 선단지지력의 상관관계분석에서 사용된 파라미터들 중에서 가장 좋은 상관성을 보여주는 것으로 나타났다. 이는 암체(rock mass)의 강도뿐만이 아니라 암석의 일축압축강도도 말뚝의 선단지지력에 중요한 역할을 하는 것을 의미한다.

선단 아래 2D 구간에서의 평균 일축압축강도와 변위에 따른 단위 선단지지력의 상관관계 분석 결과를 Fig. 18에 95% 신뢰도 곡선과 기존 학자들의 연구결과들과 함께 도시하였다. 10mm부터 직경의 1% 변위 구간에서는 일축압축강도에 대한 단위 선단지지력이 구조물 기초설계기준(2003)에서 제시한 일축압축강도의 1/8~1/5 사이에 존재하는 것으로 나타났다. 일축압축강도를 이용한 변위별 선단지지력 산정식은 Table 6에 요약되어있다.

Table 6. Developed empirical relations using compressive strength of rock core

Mobilized displacement (mm)

Empirical equation (MPa)

http://static.apub.kr/journalsite/sites/kgs/2013-029-07/N0990290702/images/PIC8232.gif

5

http://static.apub.kr/journalsite/sites/kgs/2013-029-07/N0990290702/images/PIC8253.gif

0.7687

10

http://static.apub.kr/journalsite/sites/kgs/2013-029-07/N0990290702/images/PIC8263.gif

0.8133

25.4

http://static.apub.kr/journalsite/sites/kgs/2013-029-07/N0990290702/images/PIC8293.gif

0.8800

1% of diameter

http://static.apub.kr/journalsite/sites/kgs/2013-029-07/N0990290702/images/PIC82A4.gif

0.8586

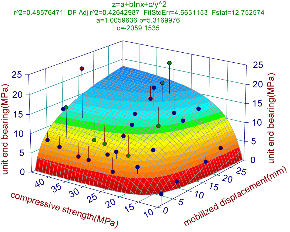
주면 마찰력 분석법에서와 같이 전체 변위 구간에서 선단지지력과의 상관관계를 도출하기 위하여 Fig. 18과 Table 6에 나타낸 일축압축강도와 단위 선단지지력의 상관관계식을 이용하여 3차원 회귀분석(다중 회귀분석)을 실시하였다. 그 결과는 Fig. 19에 도시하였으며 Eq. (2)는 그 관계를 나타낸다.

http://static.apub.kr/journalsite/sites/kgs/2013-029-07/N0990290702/images/PIC85C2.gif

http://static.apub.kr/journalsite/sites/kgs/2013-029-07/N0990290702/images/PIC86CC.gif

(a) 5 mm displacement

(b) 10 mm displacement

http://static.apub.kr/journalsite/sites/kgs/2013-029-07/N0990290702/images/PIC87E7.gif

http://static.apub.kr/journalsite/sites/kgs/2013-029-07/N0990290702/images/PIC897E.gif

(c) 25.4 mm displacement

(d) 1% of diameter displacement

Fig. 18. Empirical relations between maximum mobilized unit end bearing capacity and unconfined compressive strength depending on mobilized displacement

http://static.apub.kr/journalsite/sites/kgs/2013-029-07/N0990290702/images/PIC8AB7.gif

Fig. 19. Multiple regression analysis using end bearing capacity, compressive strength and displacement

qult=1+5.32・lnδ-2059/σc2,R2=0.486 (2)

여기서, 

qult : 최대 단위 선단지지력(MPa)

δ  : 발생변위(mm)

σc  : 암석의 일축압축강도(MPa)(≥10MPa)

R2 : 결정계수(상관계수)

다중 회귀분석의 결정계수는 0.486으로서 선단지지력, 압축강도 및 발생변위가 서로 유의한 관계에 있음을 알 수 있으며, Eq. (2)의 적용 변위의 최대 한계는 약 25.4mm이다.

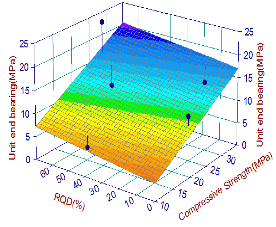
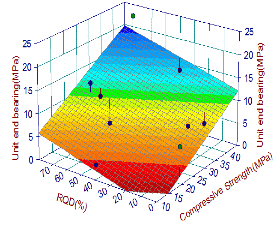
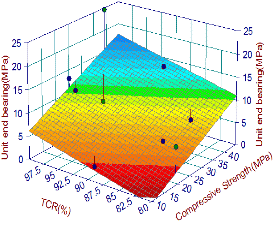
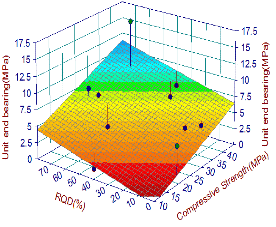
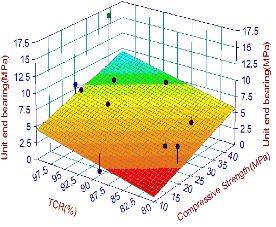
암반 소켓말뚝은 결점이 없는 신선암(intact rock)이 아니라 불연속면들이 존재하는 암체(rock mass)에 시공되므로 선단지지력을 결정할 때에는 암석의 강도뿐만 아니라 불연속면의 영향을 고려하여야 한다. 불연속면의 영향을 고려할 수 있는 반경험적이고 해석적인 방법을 Serrano and Olalla(2002)가 제안하였지만, 그 해석법이 매우 복잡하고 사용된 변수들을 실무에서 산정하기가 어려운 문제점들이 있다. 따라서, 본 연구에서는 실무에서 손쉽게 적용할 수 있도록 RQD 또는 TCR을 이용하여 암반의 불연속면의 영향을 반영하고, 암석의 일축압축강도와 연계 적용하는 다중회귀 분석을 변위별로 실시하여 그 결과를 Fig. 20과 21에 각각 도시하였다. 또한 발생변위 별 일축압축강도, RQD 및 TCR의 적용범위를 Fig. 20과 21에 도시하였다.

http://static.apub.kr/journalsite/sites/kgs/2013-029-07/N0990290702/images/PIC8C9D.gif

http://static.apub.kr/journalsite/sites/kgs/2013-029-07/N0990290702/images/PIC8CFB.gif

http://static.apub.kr/journalsite/sites/kgs/2013-029-07/N0990290702/images/PIC8E16.gif

http://static.apub.kr/journalsite/sites/kgs/2013-029-07/N0990290702/images/PIC8EB3.gif

(a) 5 mm displacement

(b) 10 mm displacement

http://static.apub.kr/journalsite/sites/kgs/2013-029-07/N0990290702/images/PIC9069.gif

http://static.apub.kr/journalsite/sites/kgs/2013-029-07/N0990290702/images/PIC90D8.gif

http://static.apub.kr/journalsite/sites/kgs/2013-029-07/N0990290702/images/PIC9185.gif

http://static.apub.kr/journalsite/sites/kgs/2013-029-07/N0990290702/images/PIC9203.gif

(c) 25.4 mm displacement

(d) 1% of diameter displacement

Fig. 20. Multiple regression analysis between end bearing, compressive strength and RQD depending on mobilized displacement

6. 결 론

본 연구에서는 최근 해상교량 현장과 초고층 빌딩 현장에서 실시된 13개의 대구경 현장타설말뚝의 양방향 재하시험결과를 분석하였다. 문헌연구를 통해 극한지지력 발생 변위를 5, 10, 25.4mm 및 직경의 1% 등으로 다양하게 설정하고 각 기준변위에 대하여 지반조사결과들과 상관성 분석을 실시하여 다음과 같은 결론을 도출하였다.

(1)TCR, RQD, RMR, GSI, 변형계수, 그리고 일축압축강도와 각 기준변위에서의 극한 주면마찰력과의 상관관계를 분석한 결과, 변형계수와 일축압축강도가 극한 주면마찰력과 서로 높은 상관성을 가지는 것으로 나타났다. 이는 암반의 불연속면의 특성을 내포하는 TCR, RQD, RMR, GSI등의 파라미터와 달리 암반의 변형계수와 암석의 일축압축강도가 암반-말뚝간의 전단 변위와 전단강도 특성과 관련된 파라미터임에 기인한 것으로 판단된다. 이러한 분석결과를 바탕으로 변형계수와 일축압축강도에 대해서 기준 변위별 극한 주면마찰력 산정식을 제안하였으며 각 변위별 일축압축강도와 극한 주면마찰력에 대한 다중회귀분석을 실시하여 변위에 따른 극한 주면마찰력 산정식을 제안하였다.

http://static.apub.kr/journalsite/sites/kgs/2013-029-07/N0990290702/images/PIC92B0.gif

http://static.apub.kr/journalsite/sites/kgs/2013-029-07/N0990290702/images/PIC930E.gif

http://static.apub.kr/journalsite/sites/kgs/2013-029-07/N0990290702/images/PIC93CB.gif

http://static.apub.kr/journalsite/sites/kgs/2013-029-07/N0990290702/images/PIC9449.gif

(a) 5 mm displacement

(b) 10 mm displacement

http://static.apub.kr/journalsite/sites/kgs/2013-029-07/N0990290702/images/PIC94F6.gif

http://static.apub.kr/journalsite/sites/kgs/2013-029-07/N0990290702/images/PIC9574.gif

http://static.apub.kr/journalsite/sites/kgs/2013-029-07/N0990290702/images/PIC9630.gif

http://static.apub.kr/journalsite/sites/kgs/2013-029-07/N0990290702/images/PIC9F59.gif

(c) 25.4 mm displacement

(d) 1% of diameter displacement

Fig. 21. Multiple regression analysis between end bearing, compressive strength and TCR depending on mobilized displacement

(2)TCR, RQD, RMR, GSI, 변형계수, 그리고 일축압축강도와 각 기준변위에서의 극한 선단지지력과의 상관관계를 분석한 결과, 불연속면의 특성을 나타내는 TCR과 암반의 전단강도와 직접 관련된 암석의 일축압축강도가 극한 선단지지력과 서로 높은 상관성을 가지는 것으로 나타났다. 이러한 분석결과를 바탕으로 각 암반분류 및 암반정수들에 대해서 기준 변위별 극한 선단지지력 산정식을 제안하였으며 각 변위별 일축압축강도와 극한 선단지지력에 대한 다중회귀분석을 실시하여 변위에 따른 극한 선단지지력 산정식을 제안하였다.

(3)선단지지력의 경우, RQD 또는 TCR을 이용하여 암반의 불연속면 영향을 반영하고 변위에 따른 암석의 일축압축강도와 연계 적용하는 다중회귀 분석을 실시하여 암체의 상태와 강도가 고려된 선단지지력 산정식을 제안하였다. 그러나 주면마찰력의 경우에는 이러한 불연속면의 영향과는 상관성이 다소 부족한 것으로 나타났다.


Acknowledgements

본 연구는 국토해양부 R&D 연구과제 “초장대교량 사업단”의 연구비 지원에 의해 수행되었으며 이에 감사드립니다.

References

1
1.Abdelrazaq, A., Poulos, H. G., Badelow, F., and Kim, S. H. (2011), Foundation Design and Pile Testing Program for the 151 Story Incheon Tower in Reclamation Area, Proceedings of the 7th International Conference on Tall Buildings, Incheon, Korea, pp. 815-823.
2
2.AASHTO (1996), Standard Specifications for Highway Bridges. (16th Ed.), American Association of State Highway and Transportation Officials, Washington, D.C.
3
3.CGS (1992), Canadian Foundation Engineering Manual. (3nd Ed.), Canadian Geotechnical Society, Ottawa, Canada.
4
4.GEO (2006), Foundation Design and Construction, Geotechnical Engineering Office, Hong Kong.
5
5.Horvath, R. G. and Kenney, T. C. (1979), “Shaft Resistance of Rock-Socketed Drilled Piers”, Proceedings, Symposium on Deep Foundations, ASCE, Atlanta, Georgia, pp.182-214.
6
6.Kim, M. M. (2007), “The Bi-directional Pile Load Test”, Workshop in commemoration of the establishment of the ATC-18 Mega foundation, KGS pile foundation committee, Seoul, Korea, pp. 89-98.
7
7.Korean Geotechnical Society (2003), Korea structure and foundation design specification (KSFDS), pp.348-350.
8
8.Kwon, O. S. (2004), Effect of rock mass weathering on resistant behavior of drilled shaft socketed into weathered rock, Ph.D. Dissertation, Seoul University, Seoul.
9
9.Ng, C.W.W., Yau, T.L.Y., Li, J.H.M., and Tang, W. H. (2001), “Side resistance of large diameter bored piles socketed into decomposed rocks”, Journal of Geotechnical and Geoenvironmental Engineering, American Society of Civil Engineers, 127(8), pp.642-657.
10
10.Osterberg, J.O. (1998), “The Osterberg load test method for bored and driven piles the first ten years”, Proceedings of the 7th International Conference on Piling and Deep Foundations, Vienna, pp.1-11.
11
11.Osterberg, J.O. (2001), “Load testing high capacity piles what have we learned?”, Proceedings of the 5th international conference on deep foundation practice, Singapore.
12
12.Peck, R. B., Hanson, W. E., and Thornburn, T. H. (1974), Foundation Engineering (2nd ed.), John Wiley and Sons, New York, pp.361-374.
13
13.Rosenberg, P. and Journeaux, N. L. (1976), “Friction and End Bearing Tests on Bedrock for High Capacity Socket Design”, Canadian Geotechnical Journal, Vol.13, pp.324-333.
14
14.Rowe, R. K. and Armitage, H. H. (1987), “A Design Method for Drilled Piers in Soft Rock”, Canadian Geotechnical Journal, Vol.24, pp.126-142.
15
15.Seol, H.I. (2007), Load Transfer Analysis of Rock-Socketed Drilled Shafts by considering Coupled Soil Resistance, Ph.D. Dissertation, The Graduate School Yonsei University Department of Civil Engineering, Seoul, Korea, pp.93-95.
16
16.Serrano, A. and Olalla, C. (2002), “Ultimate bearing capacity at the tip of a pile in rock – part 1: theory”, International Journal of Rock Mechanics and Mining Science & Geomechanics Abstracts, 39(7), pp.883-846.
17
17.Song, M. J., Park, Y. H., and Kim, D. J. (2005), “Preliminary Load Tests for the Design of Large Diameter Drilled Shaft by Bi-directional Loading Method at Toe”, KGS Spring Conference, Jeju, Korea, pp.89-98.
18
18.Song, M. J., Kim, D. J., Park, Y. H., and Cho, S. (2006), “Joint Pile Load Tests by Multi Level Bi-directional Test Method for Incheon Bridge”, KGS Fall Conference, Daegu, Korea, pp.689-697.
19
19.Williams, A. F. and Pells, P. J. N. (1981), “Side Resistance of Rock Sockets in Sandstone, Mudstone, and Shale”, Canadian Geotechnical Journal, Vol.18, pp.502-513.
20
20.Vipulanandan, C., Hussain, A., and Usluogulari, O. (2007), “Parametric study of open core-hole on the behavior of drilled shafts socketed in soft rock”, In Contemporary Issues in Deep Foundations: Proceedings of Geo-Denver 2007, Geotechnical Special Publication No.158, pp.18-21.
21
21.Zhang, L. and Einstein, H. H. (1998), “End Bearing Capacity of Drilled Shafts in Rock”, Journal of the Geotechnical and Geo-environmental Engineering, ASCE, Vol.124, No.7, pp.574-584.
페이지 상단으로 이동하기