

1. Introduction
Earthquakes have caused tremendous damage to our energy infrastructure. For example, the 2007 Niigata-ken Chūetsu offshore earthquake caused the Kashiwazaki-Kariwa nuclear power plant to shut down operations while the 2011 Great Tohoku earthquake caused a tsunami that unfortunately resulted in the meltdown of the Fukushima Daiichi nuclear power plant as well as significant damage to the surrounding power plants and facilities. These events are typically planned by scientists and engineers by applying earthquake engineering principles in their designs to mitigate seismic hazards at nuclear power plants (NPP). The general solution is to design NPPs for an increased level of shaking. In the area of NPP structural or building design, seismic design requirements have led to increases in reinforcing steel to carry in-plane seismic shear and overturning. It has also lead to a significant increase in engineering effort required to analyze and design such structures. In mechanical and electrical distribution systems design, additional lateral supports and damping systems may be required to carry seismic loads. These solutions affect potential NPP owners as construction and design costs increase for higher levels of seismic shaking. Therefore, NPPs designed in anticipation of higher levels of seismic shaking may not be an ideal solution as some NPP sites may not warrant higher levels of shaking due to low seismic potential.
The state-of-practice for accounting for varying levels of shaking at an NPP site is seismic hazard analysis, which is categorized as either Deterministic Seismic Hazard Analysis (DSHA) or Probabilistic Seismic Hazard Analysis (PSHA). Seismic hazard analyses require a predictive relationship in the analysis procedure, more commonly known as a ground motion prediction equation (GMPE). A majority of GMPEs relate peak ground acceleration (PGA) generated by an earthquake event with parameters such as distance and magnitude. There are many GMPEs available (Douglas, 2011), with the most popular GMPEs coming from the Next Generation Attenuation (NGA) programs by the Pacific Earthquake Engineering Research Center. These first release of NGA GMPEs consisted of five relationships proposed by Abrahamson and Silva (2008), Boore and Atkinson (2008), Campbell and Bozorgnia (2008), Chiou and Youngs (2008), and Idriss (2008), each utilizing a different subset of a common database to fit their needs and scenarios. The most current NGA programs include NGA-west2 and NGA-east (Goulet et al., 2011; Bozorgnia et al., 2014; Seyhan et al., 2014). The NGA-west2 program was an upgrade to the original GMPEs. Additionally, models from the NGA programs, as well as other more sophisticated models, are becoming increasingly complex, sometimes with parameters that are not easily obtainable. Although this additional complexity occasionally provides more robustness in their models, it is sometimes impractical for preliminary studies and forces the designer to select values for parameters that might not be applicable or even reasonably obtained. Moreover, several researchers use simulations to provide additional data for some aspects of model development.
However, many of the attenuation relationships were not developed based on typical NPP site conditions. NPPs are typically founded on bedrock, which behaves differently than soil. The GMPEs presented by Abrahamson and Silva (2008), Boore and Atkinson (2008), Campbell and Bozorgnia (2008), and Chiou and Youngs (2008) were developed based on data from soil and rock sites, rendering them unsuitable for typical nuclear and turbine island site conditions. One GMPE, presented by Idriss (2008), was developed using rock site conditions, which was defined through a shear wave velocity parameter. Idriss (2008) did not specifically derive the GMPE by selecting rock sites, but by using site shear wave velocities in the upper 30 m, Vs30, greater than 450 m/s. Although this is a reasonable approach, and in line with most building codes, it is possible to find rock sites with Vs30 less than 450 m/s as well as soil sites with Vs30 greater than 450 m/s. With this backdrop, this study focuses on the development of an elementary GMPE which can be suitable for NPP siting scenarios. This paper will show the variety of data collected from Japan to develop a database of rock sites to be used to empirically regress a simple model relating easily obtainable parameters to rock site PGA.
2. Database
The National Research Institute for Earth Science and Disaster Prevention in Japan has two large networks of recording stations all over Japan. These networks are called K-NET and KiK-net. K-NET (Kyoshin network) is a nation-wide strong-motion seismograph network consisting of over 1,000 observation stations (Aoi et al., 2004; Dawood et al., 2016). The seismograph stations are uniformly installed on the ground surface every 20 km all over Japan. The other network, KiK-net (Kiban Kyoshin network), has stations deployed at approximately 700 locations in Japan. This strong-motion seismograph network consists of pairs of seismographs installed in a borehole along with seismographs on the ground surface.
To help filter the data, free-field records from seismographs that were installed on rock were selected for this study. The geology at each site was determined through network provided borehole logs. From this compilation, fifteen main shocks were used in this study, which are listed in Table 1. Using the free-field rock criteria, strong motion records were reduced to 15 seismic events containing a total of 199 records. Earthquakes were named after the general hypocentral location and magnitude is taken as moment magnitude.
Table 1. Earthquakes considered for this study
Each record contains time history data for east-west, north-south, and up-down directional components. For our analysis, only the two horizontal components, east-west and north-south, will be considered. The resultant PGA for each direction was taken as the maximum of the Euclidean distances between east-west and north-south directions for each event.
Hypocentral distance is also similarly calculated by taking the Euclidean distance between the epicentral distance and hypocenter depth. The epicentral distance was calculated by using the Haversine formula, as shown in Eq. (3), on the location of the epicenter and recording station. Note that this is different from other NGA relationships which separate depth and require the use of various distance calculations. The resultant hypocentral distance is named distance to rupture, R, hereafter.
(1)
(2)
(3)
(4)
(5)
Where lat = latitude in radians, long = longitude in radians, r = 6,371 km, radius of the Earth. To demonstrate the distribution of the database, Fig. 1 shows the magnitude-distance distribution for the resultant database. The figure shows there is little data at distances less than 50 km and a little data for magnitudes larger than 7.5, although earthquakes of such magnitude are considered rare. Fig. 2 plots the relationship between Vs30 and PGA, The figure shows there are some rock sites with Vs30 less than 450 m/s, but very few data for Vs30 larger than 1,000 m/s. Additionally, some of the site data do not have geophysical data up to 30 m. For completeness, the Vs30 for sites that did not have geophysical data to 30 m depth had Vs30 estimated by extending the lowest rock layer to 30 m and calculating the adjusted shear wave velocity.
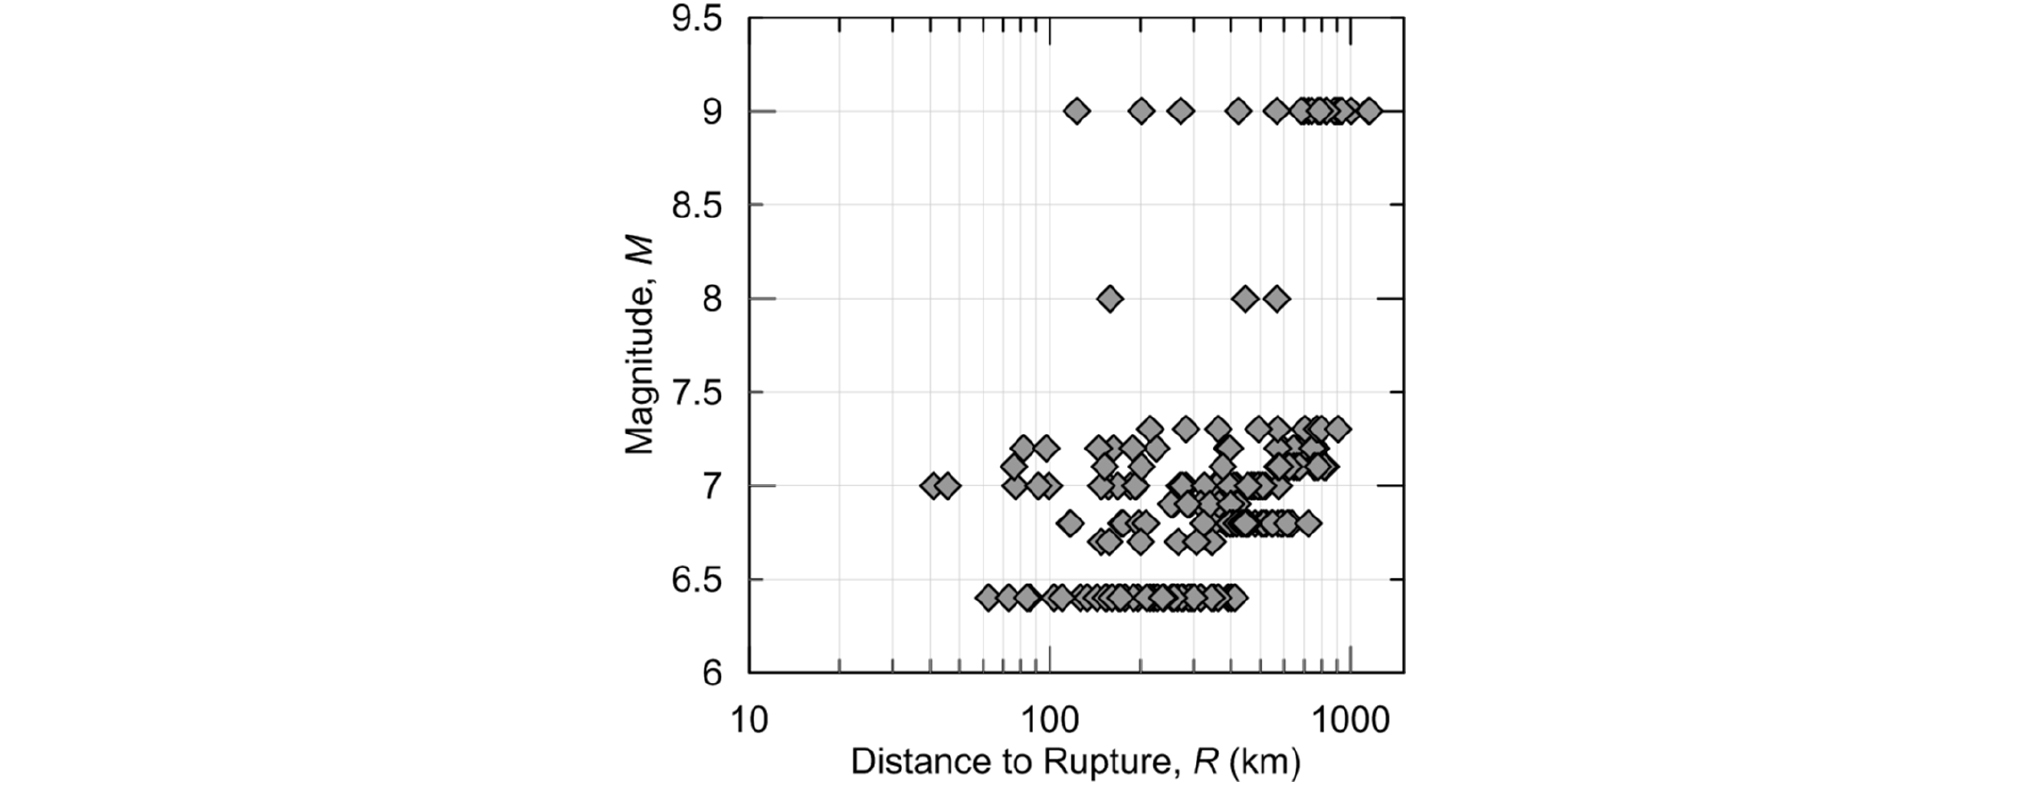
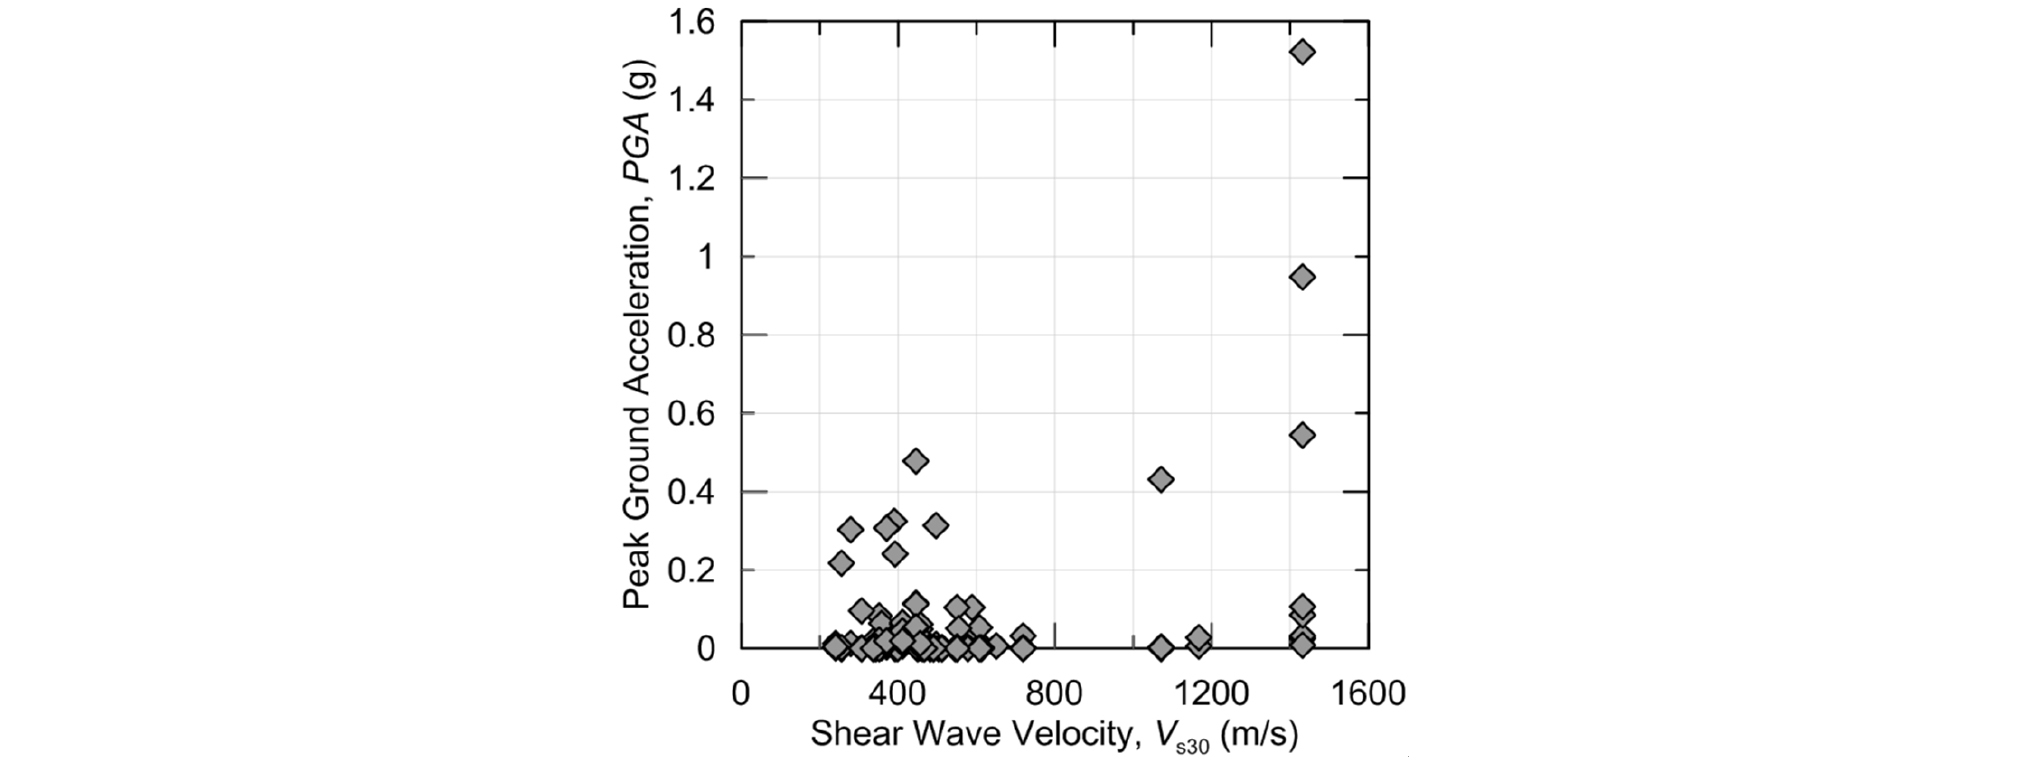
Table 1 also lists the fault mechanisms in the database. The table suggests very few recordings from normal and strike-slip faulting scenarios, which is not uncommon for the Japan region. Considering the lack of data and to help simplify data processing, records with normal or strike- slip faulting mechanisms were combined into one category. This is also the approach NGA programs use in their attenuation models.
3. Empirical Model
To keep the model simple, a straightforward empirical approach was taken to remove complicated mathematical formulations. A multi-linear regression analysis was performed using results from the compiled database to relate easily obtainable engineering parameters to the PGA. The form is shown as:
(6)
The variables in this form include PGA (g), magnitude, M, hypocentral depth, Z (km), and hypocentral distance R (km). For the functional form, variables such as magnitude and distance were included, but Vs30 was purposely left out as it is not an easily obtainable site parameter and the focus of this study is for rock sites. Analyses later showed that Vs30 did not have a significant impact on results. However, it was observed that depth did have some contribution and was thus included. The multi-linear regression approach minimized the objective function of a sum of the square of the residuals, where the residuals were conventionally calculated as the difference between the natural logarithm of the PGA data and the estimate given by Eq. (6). This was performed manually in excel and this approach is also the way how basic regression is performed (e.g. Illowsky and Dean, 2017), unlike Daoud et al. (2016). The coefficients are separated by focal mechanism and are shown in Table 2. Since the data for normal or strike-slip seismic events in the database were relatively sparse, the regressions may be weakly constrained.
Table 2. Coefficients for empirical model
| Earthquake Mechanism | c1 | c2 | c3 | c4 | c5 | c6 | σln |
| Normal/Strike-slip | 22.97 | -3.09 | 0.21 | -8.81 | 1.05 | -0.005 | 2.05 |
| Reverse | -18.06 | 4.29 | 0.05 | 0.01 | -0.48 | 0.0005 | 1.00 |
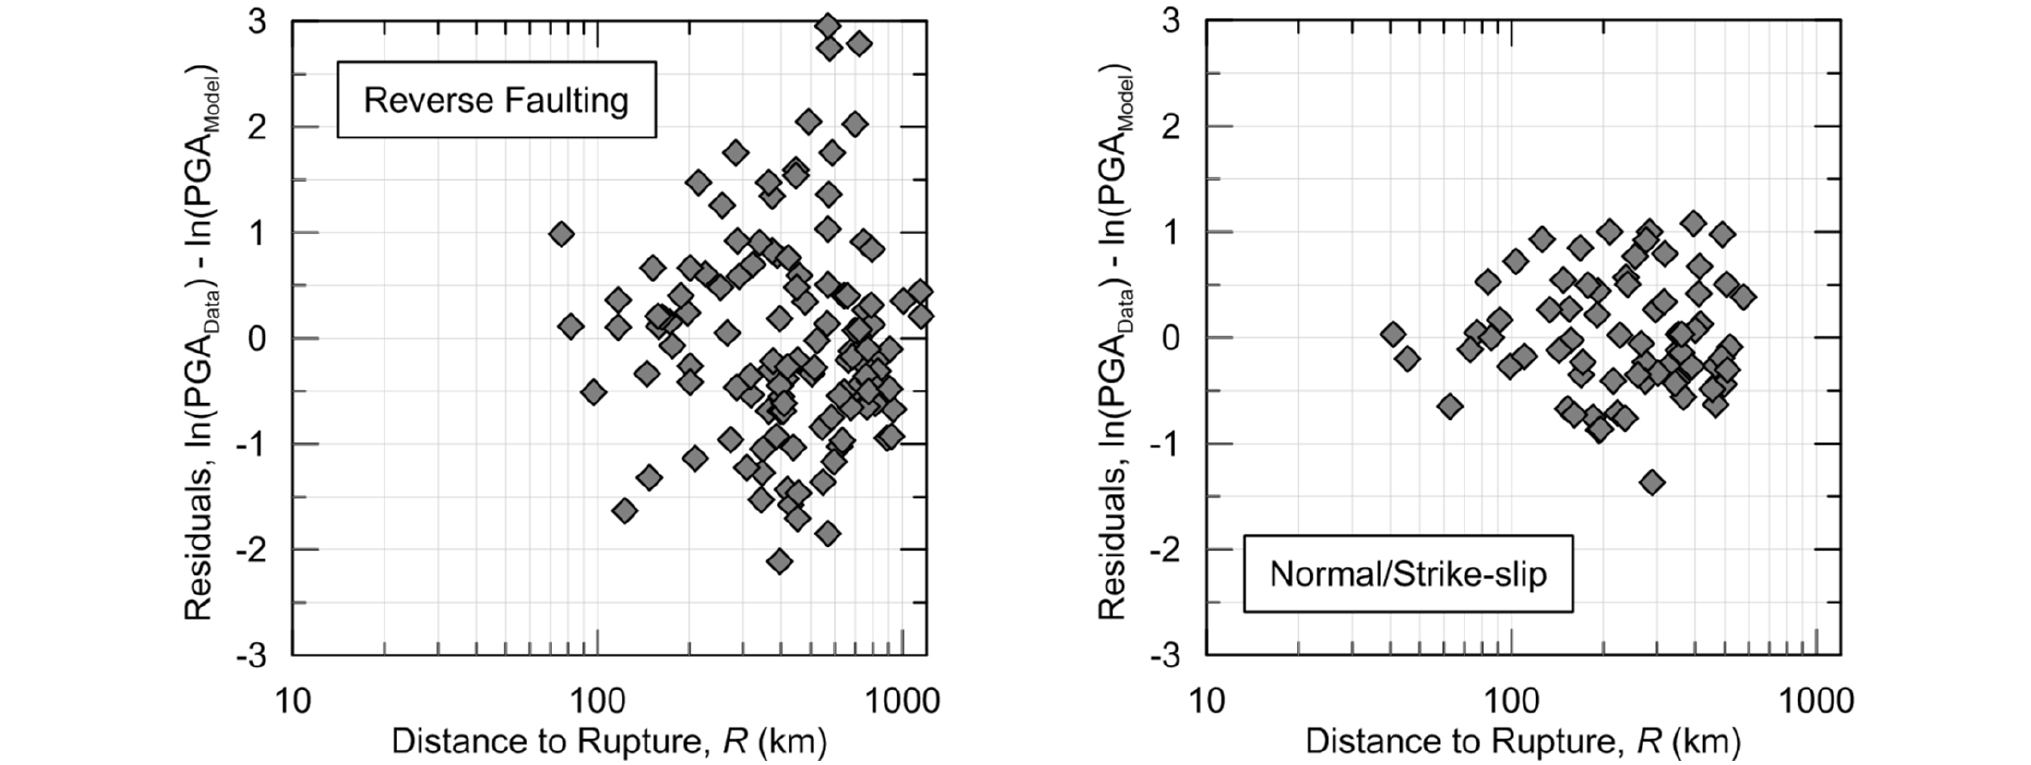
Fig. 3 compares the residuals of the empirical model. Since the relationship is separated into two faulting mechanisms, the residuals are shown as two plots, one for reverse faulting and the other for normal/strike-slip faulting. The ln(PGA) residuals for the normal/strike-slip form range from -1.37 g to 1.08 g with a majority of the data between ±0.54 ln(g), while ln(PGA) residuals for the reverse form are generally from -2.11 and 3.44 with a majority of the data also between ±1.00 ln(g). This is attributed to a large amount of data at very large distances, near 1,000 km. Although aftershocks could be used as a source of additional data, they were not included as there is a history of seeing larger residuals for aftershock events.
4. Discussion
To shed some light on the performance of the model, Fig. 4 plots the proposed model against data from two earthquakes, the 2005 Fukuoka Prefecture, offshore west earthquake and the 2011 Miyagi Prefecture, offshore earthquake. The western offshore Fukuoka earthquake was a relatively shallow earthquake and was the result of a normal faulting mechanism. The figure suggests the empirical model to capture the western offshore Fukuoka earthquake event quite well. On the flip side, the offshore Miyagi earthquake was a reverse faulting earthquake of moderate hypocentral depth. The figure suggests the proposed model underpredicts PGA when rupture distance is less than about 600 km. However, the PGA levels are quite low at that distance and may not be of engineering significance.

After reviewing several other seismic events in the database, the proposed empirical model generally holds well. Fig. 4 also compares the proposed empirical model to that from Idriss (2008). The model from Idriss (2008) is generally considered for rock sites due to its database filtration criteria, although it does contain some soil sites. The figure shows the Idriss (2008) model to underpredict data from both Japanese earthquakes. The figure also shows the Idriss (2008) model to predict lower values of PGA relative to the proposed empirical model. This under-prediction becomes significant as the rupture distance decreases. This discrepancy is most likely not a result of the different definitions of rupture distance, nor that the Idriss (2008) model does not directly account for hypocentral depth. Both models do not explicitly use Vs30 as there appeared to be little effect on PGA values. The most obvious differences between the models are the data that were used to derive them, as it is well known that the PGA-R slope is steeper for Japanese sites than it is for sites in the Western United States, which was what the NGA program that Idriss (2008) came from was originally targeting. This steepness is also indirectly shown in Fig. 4 as well.
5. Conclusion
The database used in this study was developed from K-NET and KiK-Net, which are Japanese seismograph networks. After filtering the dataset, it was clear that there were not enough data to regress a more complete model as there were lack of data in several sections, such as records from short distances (less than 100 km.) and also the limiting number of earthquake events, which resulted in lack of data for several magnitude levels, especially the lower magnitudes. Additionally, data from Japan showed a steeper slope for the peak ground acceleration and hypocenter distance relation when compared to a previous model.
Although the proposed model is rudimentary, it performed well when compared to the database. The proposed model considered magnitude, hypocentral distance, and hypocentral depth as input, with a higher standard deviation for the normal/strike-slip faulting model relative to the reverse faulting model. The simplicity of the model, along with easily obtainable variables, make the proposed model very applicable to studies such as preliminary hazard analysis, especially for nuclear power plant sites.
