


1. Introduction

Braced excavations are used extensively in the construc-tion of high-rise structures and underground facilities in congested urban areas. On the other hand, the impact of these excavation works on the surrounding environment has become a major concern. In particular, a miscalculation of the earth pressure on the excavation walls can cause the collapse of the support systems in open cuts that eventually leads to substantial time loss, financial damage, work stoppages, legal action, and compensation. Therefore, it is important to ensure the safety of the support system in urban underground structures and minimize the related problems (both social and economic ones). In addition, it is also necessary to clearly understand the behavioral characteristics of the ground and excavation walls and have a clear understanding of the ground-wall interactions.
Many studies have examined the earth pressure on the retaining walls caused by ground excavation works through experimental, analytical and numerical assessments (Peck, 1969; Tschebotarioff, 1973; Lambe and Whitman, 1978; Potts and Fourie, 1986; Liao and Neff, 1990; Wong et al., 1997; Hashash and Whittle, 2002; Worden and Achmus, 2013). Most of these studies focused mainly on the soil ground (sand and clay). Fig. 1 shows the apparent earth pressure envelopes suggested by Peck (1969) and Tschebotarioff (1973), which are used widely as the support systems in soil ground. Other related studies measured the earth pressure on the excavation walls in multi-layered ground including soil and rocks (Chae and Moon, 1994; Jeong and Kim, 1997; Yoo and Kim, 2000). These studies simply compared the measured earth pressures with Peck’s empirical earth pressure and did not consider the effects of the rock and joint conditions.
In other words, few studies have examined the earth pressure in rock strata by considering the rock and joint characteristics as well as the ground-wall interactions, even though they are important factors affecting the magnitude and distribution of earth pressure. This may be due to the general aspect that the rock strata represent a better condition than the soil ground. Recently, Son (2013), Son and Park (2014), and Son and Adedokun (2015) reported their results of the earth pressures in jointed rock masses. Their results suggested that the earth pressure can be higher for rock strata than a soil ground when the rock and joint characteristics are under unfavorable conditions, such as joint sliding con-ditions and weathered joint and rock conditions. On the other hand, the results showed that the earth pressure can be much lower than the soil ground when the rock conditions are favorable.
This study extended previous studies, focusing on the effects of different joint sets for varying rock types and joint conditions. A series of numerical parametric analyses were conducted based on a physical model test and numerical simulation. The advantages of numerical analysis are that a range of conditions can be considered easily with a limited time, cost and space, and that repro-ducible analyses are possible. This characteristic allows the effects of a joint set on the earth pressure to be examined under a number of rock and joint conditions. These results are expected to provide a better understanding of the earth pressure on the support system in a jointed rock mass by considering the rock-structure interactions.
2. Numerical parametric study
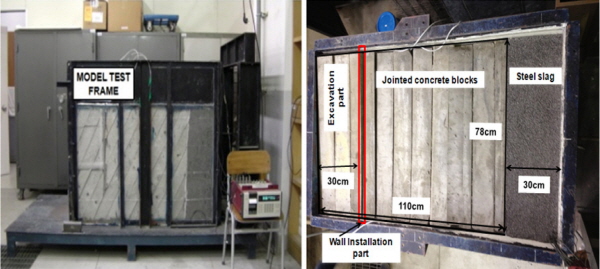
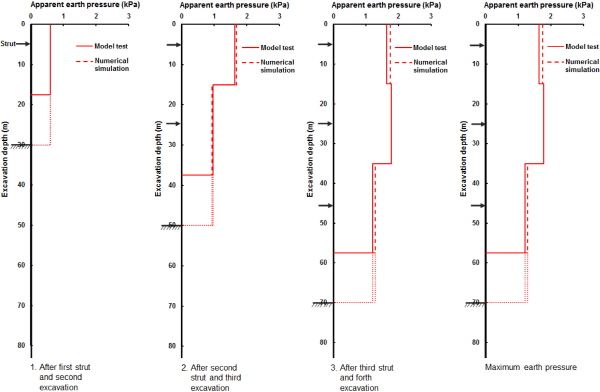
A large-scale physical model test was carried out pre-viously at Daegu University’s Geotechnical Engineering Laboratory using concrete blocks with man-made joints to represent a jointed rock mass (Fig. 2). The purpose of the test was to provide a strong base to simulate the physical model test numerically and confirm that the applied numerical approach and methodology are suitable for further extending numerical parametric studies. The numerical simulation was performed based on the measured properties of the physical model structure and by following the same procedures used in the physical model test. The results from the physical model test and numerical simulation were compared, and relatively good agreement was observed between the physical model and numerical tests (Fig. 3). Details of the results of these two tests can be found in a previous paper (Son and Park, 2014). Verification of the numerical approach was extended to this parametric study, which considered the effects of the joint set as well as the rock type and joint condition (joint shear strength and joint inclination angles).
This study adopted the 2-D Universal Distinct Element Code (UDEC, 2004), which can allow for large displace-ments between the rock blocks. The rock blocks, wall and struts were simulated as separate elastic units. The joints between the rock blocks and the interface between wall and rock were modeled using the Coulomb slip model, in which the contact loses strength and sliding occurs when the contact shear stress exceeds the contact shear strength.
|
Fig. 3. Comparison of the physical model test and numerical simulation (Son and Park, 2014) |
|
Fig. 4. Numerical modeling (a case of joint inclination angle = 60°) |

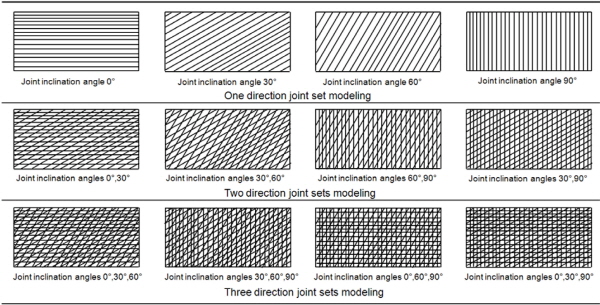
The model dimensions were 68.8 m × 31.5 m and the excavation wall was installed at a depth of 20.5 m (Fig. 4). The final excavation depth and width were assumed to be 19 m and 20 m, respectively, and the joint spacing was assumed to be 1 m. A strut-supported system was used because the apparent earth pressure (Peck, 1969), which was compared with the results in this paper, was obtained from many sets of comprehensive measurements of the strut load in the strut-supported excavation walls for the soil ground. This study considered a different joint set, rock type, and joint condition (see Figs. 5 and Table 1). The joint inclination angle was measured in an anticlockwise direction from the horizontal plane. For each of the aforementioned cases, the analysis was carried out using the solider pile and timber lagging wall.
To reflect a typical excavation condition in the field, eight stages of excavation were carried out to obtain the distribution and magnitude of the earth pressure. Before carrying out the first excavation, the initial equilibrium was obtained with the earth pressure coefficient of 0.5 at rest. At this stage, the boundary condition was a roller at each end of the two vertical boundaries and at the bottom boundary. After ensuring the initial equilibrium condition, all the displacements were reset to zero, and the wall was installed at a depth of 20.5 m. The first excavation was conducted up to 1.0 m, which was followed by installation of the first strut at 0.5 m over the exca-vation line. After the first excavation, there was additional excavation work every 3 m, which was followed by the strut installation every 3 m interval (which is 0.5 m above each excavation line). Wall stabilization was ensured after each excavation stage. The final excavation was carried out up to 19.0 m, and no strut was installed in the final stages (see Fig. 6). This study considered the transformed simple wall section providing the equivalent flexural stiffness of the actual excavation wall (see Fig. 7). Table 2 lists the properties of the wall, rocks, joints, and interfaces used in numerical analysis.
3. Effect of joint set on earth pressure
The effects of a different joint set on the magnitude and distribution of earth pressure were examined and the joint spacing was assumed to be 1 m. The results of the numerical tests are discussed.
Fig. 8 compares the apparent earth pressures for hard rock due to the varying joint sets and joint inclination angles with Peck’s empirical earth pressure based on sand ground with the friction angle of  = 35°. The apparent earth pressure was calculated in the same manner as reported by Peck (1969), which was inferred from the strut loads, and the apparent earth


pressure ratio in the figure represents the ratio of the earth pressure induced from numerical analysis to Peck’s empirical earth pressure. Fig. 9 presents the total earth pressure ratios between the earth pressure induced from numerical analysis and Peck’s empirical earth pressure for sand ground.
Under a single joint set, the apparent earth pressures for joint inclination angles of 0°, 30° and 90°, where no sliding was induced at the joint inclination angle, were very small and similar but the earth pressure increased significantly for a joint inclination angle of 60°, where joint sliding occurred at the inclination angle. The total earth pressure ratio was approximately
|
Fig. 8. Comparison of the apparent earth pressure ratio for hard rock |
|
Fig. 9. Comparison of the total earth pressure between the numerical tests for hard rock and Peck’s empirical earth pressure |


0.02 for joint inclination angles of 0°, 30° and 90°, but it was as high as 0.7 for a joint inclination angle of 60° (see Fig. 9).
Under two joint sets, the apparent earth pressures were similar to those of a single joint set depending on the inclusion of joint inclination angle of 60°. Regardless of the combination of joint inclination angles, the earth pressure increased significantly when one of the joint sets included a sliding condition, such as (30°, 60°) and (60°, 90°). The total earth pressure ratio was approximately 0.03 and 0.70 for the no joint sliding condition and the conditions including joint sliding, respectively.
Under the three joint sets, the apparent earth pressures were slightly higher than those of one or two joint sets depending on the inclusion of a joint inclination angle of 60°. The earth pressure also increased significantly when one of the joint sets included a sliding condition, such as (0°, 30°, 60°) and (0°, 60°, 90°), regardless of the combination of joint inclination angles. The total earth pressure ratio was approximately 0.04 for the no joint sliding condition and about 0.75 for the conditions including joint sliding. For the joint sliding condition, the induced earth pressure was high at the upper part of the wall and decreased with depth.

These results clearly suggest that for hard rock, the induced earth pressure was affected by a joint set depending on the inclusion of the joint inclination angle, which induces a joint sliding condition, but the number of joint sets alone was not important, even though the earth pressure could be increased slightly with increasing number of joint sets.
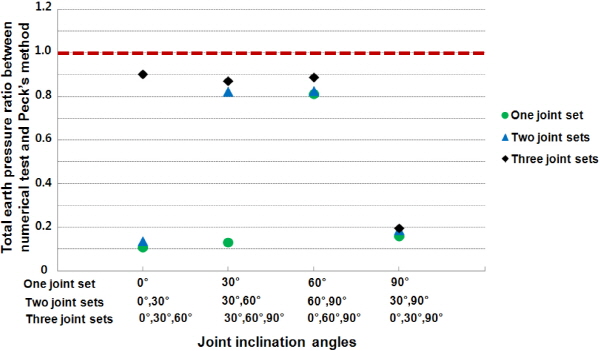
Fig. 10 compares the apparent earth pressures for slightly weathered rock due to the varying joint sets and joint inclination angles with Peck’s empirical earth pressure. Fig. 11 shows the total earth pressure ratios between the earth pressure induced from numerical analysis and Peck’s empirical earth pressure for sand ground.


The overall results were similar to those of hard rock, regardless of the joint sets, even though the earth pressure was higher than that of hard rock. Under a single joint set, the total earth pressure ratio ranged from 0.11 to 0.16 for joint inclination angles of 0°, 30° and 90°, and it was as high as 0.81 for a joint inclination angle of 60° (see Fig. 11). Under two joint sets, the apparent earth pressures were similar to those of a single joint set. The total earth pressure ratio ranged from 0.14 to 0.19 for the no joint sliding condition and approximately 0.83 for the conditions including joint sliding. Under three joint sets, the apparent earth pressures were slightly higher than those of the two joint sets. The total earth pressure ratios were 0.20 for the no joint sliding condition and it was approximately 0.9 for the conditions including joint sliding. These results suggest that the earth pressure was relatively small for the no joint sliding condition, but it increased significantly when joint sliding was induced.
Fig. 12 compares the apparent earth pressures for moderately-weathered rock due to various joint sets and joint inclination angles with Peck’s empirical earth pressure. Fig. 13 shows the total earth pressure ratios between the earth pressure induced from numerical analysis and Peck’s empirical earth pressure for sand ground.
The earth pressure increased considerably compared to those of the hard and slightly weathered rocks, regardless of the joint sets and joint inclination angles. The earth pressure difference between the no joint sliding condition and joint sliding condition was relatively small compared to those of hard and slightly weathered rocks. Under one joint set, the total earth pressure ratio ranged from 0.61 to 0.76 for joint inclination angles of 0°, 30° and 90°, and was as high as 0.94 for a joint inclination angle of 60° (see Fig. 13). Under the two joint sets, the apparent earth pressures were similar to those of a single joint set. The total earth pressure ratio ranged from 0.65 to 0.84 for the no joint sliding condition and it was approximately 1.02 for the conditions including joint sliding. Under three joint sets, the apparent earth pressures were slightly higher than those of the two joint sets. The total earth pressure ratios were 0.84 for the no joint sliding condition and ranged from 1.03 to 1.08 for the conditions including joint sliding.
These results suggest that the earth pressure increases significantly as the rock condition deteriorates regardless of the joint sets and joint inclination angles. In addition, the induced earth press is higher than that of soil ground as the rock condition deteriorates and joint sliding occurs.
4. Conclusions
The magnitude and distribution of the earth pressure on the support system in a jointed rock mass were investigated numerically. The controlled parameters included a varying joint set as well as different rock types and joint conditions (joint shear strength and joint inclination angle). The following conclusions were drawn:
(1)The induced earth pressure was affected significantly by a joint set depending on the inclusion of the joint inclination angle, which induces a joint sliding con-dition, but the number of joint sets alone was not important, even though the earth pressure could be increased slightly as the number of joint sets is increased.
(2)The earth pressure increased significantly as the rock condition deteriorated regardless of the joint sets and joint inclination angles. The induced earth pressure was higher than that of the soil ground as the rock condition became worse and joint sliding occurred.
(3)Under the considered three joint sets, the induced earth pressure for hard rock was quite small for no joint sliding condition (not including a joint inclination angle of 60°) compared to Peck’s empirical earth pressure for sand ground, but it increased to appro-ximately 75% of Peck’s earth pressure under the joint sliding failure condition (including a joint inclination angle of 60°).
(4)For slightly weathered rock, the induced earth pressure increased higher than for hard rock under no joint sliding condition and it was almost as high as Peck’s earth pressure when a joint sliding condition was included. For moderately weathered rock, the induced earth pressure increased significantly and it was much higher than for slightly weathered rock under no joint sliding condition and it was even higher than Peck’s earth pressure when a joint sliding condition was included.
(5)For slightly weathered rock, the effect of joint incli-nation angle was more evident than for hard rock. For moderately weathered rock, the increase of earth pressure was more significant under no joint sliding condition, which resulted in the smallest difference between no joint sliding condition and joint sliding condition.
(6)This study clearly shows that the earth pressure in a jointed rock mass could be considerably different from that in soil ground. Accordingly, the joint set as well as the rock type and joint condition should be considered when designing a support system in a jointed rock mass.