


1. Introduction
2. Material properties
3. Experimental program
4. Results and discussion
4.1 Specific gravity test
4.2 Sieve analysis
4.3 Atterberg limit
4.4 Compaction test
4.5 Microscopic image analysis
5. Conclusions
1. Introduction
The embankment materials for railways or roads constructions in Korea habitually contain silty and clayey soils which are found near the construction site. The fine particles in the embankment material considerably affects the physical and mechanical properties of the soil itself. Silt consists of small particles or grain of soil and minerals that easily carried and deposited by water. With the vertical load by trains on the embankment, soils with high silt contents tend to experience plastic deformation. Also, the soil in plastic state becomes weak and can lose its stiffness, and accordingly, long-term settlement will be occurred. So, to avoid these problems, the behavioural analysis on the low-plastic fine clay mixing with sand is very necessary.
The study on the stress-strain behaviour and the strength of clayey soil have been conducted by many researchers. Monkul and Ozden (2007) performed the oedometer tests on kaolinite-sand mixtures in different proportion to observe the overall stress-strain behaviour based on transition fine content. The results indicated that when the amount of fine exceeds the transition fines content, kaolinite controlled the compressive behaviour and resulted in high granular compression index. Arifina and Schanzb (2011) observed the microstructure of compacted bentonite-sand mixtures in both dry and wet conditions. The results showed that 100% of bentonite in the mixture with dry condition has a greater volume of macro-pore compared to the wet condition. For the case of 50% in both bentonite and sand, the volume of macro-pores was mostly the same in both dry and wet conditions. Benahmed et al. (2015) estimated the impact of the low plastic fines content on the mechanical behaviour regarding instability phenomena which conducted both drained and undrained triaxial compression tests. The experimental results showed that fines content had a significant effect on both resistance at the onset of instability and on the critical state position of silty sands. Chemmam et al. (2016) examined the effect of silts (low-plastic fine clay) and confining stress on the undrained shear strength in triaxial compression. The results showed that the presence of low plastic fines in sand-silt mixture leads to a more compressible soil, and consequently to a significant loss in the soil strength.
Proia et al. (2016) conducted an experimental study on the compacted sand-bentonite mixtures. The results showed that the mixtures with a low percentage of bentonite showed a behaviour of granular soils and a higher content of bentonite resulted in a behaviour of plastic clays. Elgendy et al. (2019) investigated the influence of low-plastic fines content on the properties of clean sand. Their result revealed that an increase of fine content caused a decrease of the shear strength. The void ratio also decreased as fines content increased up to 15%, and then gradually increased with further percentage of fines content. Jyothi et al. (2020) classified the behaviour of the mixture of sand with both low-plastic fines (kaolinite and bentonite) based on specific gravity, and Atterberg limit test. The data indicated that an increase in percentage of kaolinite and bentonite caused an increase in value of specific gravity (Gs), Liquid limit (LL) and Plastic limit (PL). In addition, those values of LL and PL in case of bentonite are higher than kaolinite in mixtures.
Based on forementioned studies, the effect of low-plastic fines on the strength of soil has been well studied. However, the behavioural analysis and the bonding structure according to the percentage of fine content in the mixture have not been enlightened. Therefore, this paper presents the investigation on kaolinite-sand mixtures with various fine clay proportions (10, 25, 30, 40, 60, 70% of the host material) through the index properties results. Moreover, to provide a better comprehend on the behaviour of mixtures for the in-situ placement method utilized for earth embankments and landfills base layers, the mixtures were compacted by Standard Proctor test with method D. Also, to analyse the bonding structure of mixtures, the micromechanics of fine particles was investigated based on the microscopic image analysis.
2. Material properties
The host material in this study is CEN standard sand also named as ISO sand (TSI, 2002). Its specific grain size distribution ranges between 0.08 and 2.00 mm and the grain size distributions are summarized in Table 1. The uniformity coefficient (Cu) and coefficient of gradation (Cc) equal to 2.14 and 1.49, respectively. Also, its specific gravity (Gs,CEN) is 2.61. The second material is kaolinite (KC) which has the chemical formula of Al2[Si2O5](OH)4 and the specific gravity (Gs,KC) is 2.80. Each percentage of chemical composition was detailed in Table 2.
3. Experimental program
The mixtures of CEN standard sand and kaolinite were mixed with six different ratios of kaolinite. To evaluate both physical properties of those mixtures, six mixing ratios (10, 25, 30, 40, and 70% KC of the CEN standard sand weight) were chosen to perform the index properties tests. Moreover, to observe the packing structure of the mixtures, the representative samples (all cases of mixture) were examined by microscopic image analysis device (HF-MAC01) with x125 magnification.
4. Results and discussion
4.1 Specific gravity test
The specific gravity test was carried out according to ASTM D-854. Figure 1 shows the results of specific gravity values in six mixtures (10, 25, 30, 40, 60 and 70% KC of the CEN weight). The overall results indicated that the increase in percentage of KC caused the increase in value of Gs. This was due to the fine content of kaolinite leading to subtraction of the voids in the mixture. Mathematically, The specific gravity (Gs) of the mixture could also be simply calculated in function of Gs,CEN and Gs,KC as Equation 1. The error values between the measurement data and the theorical calculation were mostly less than 1% as detailed in Table 3.
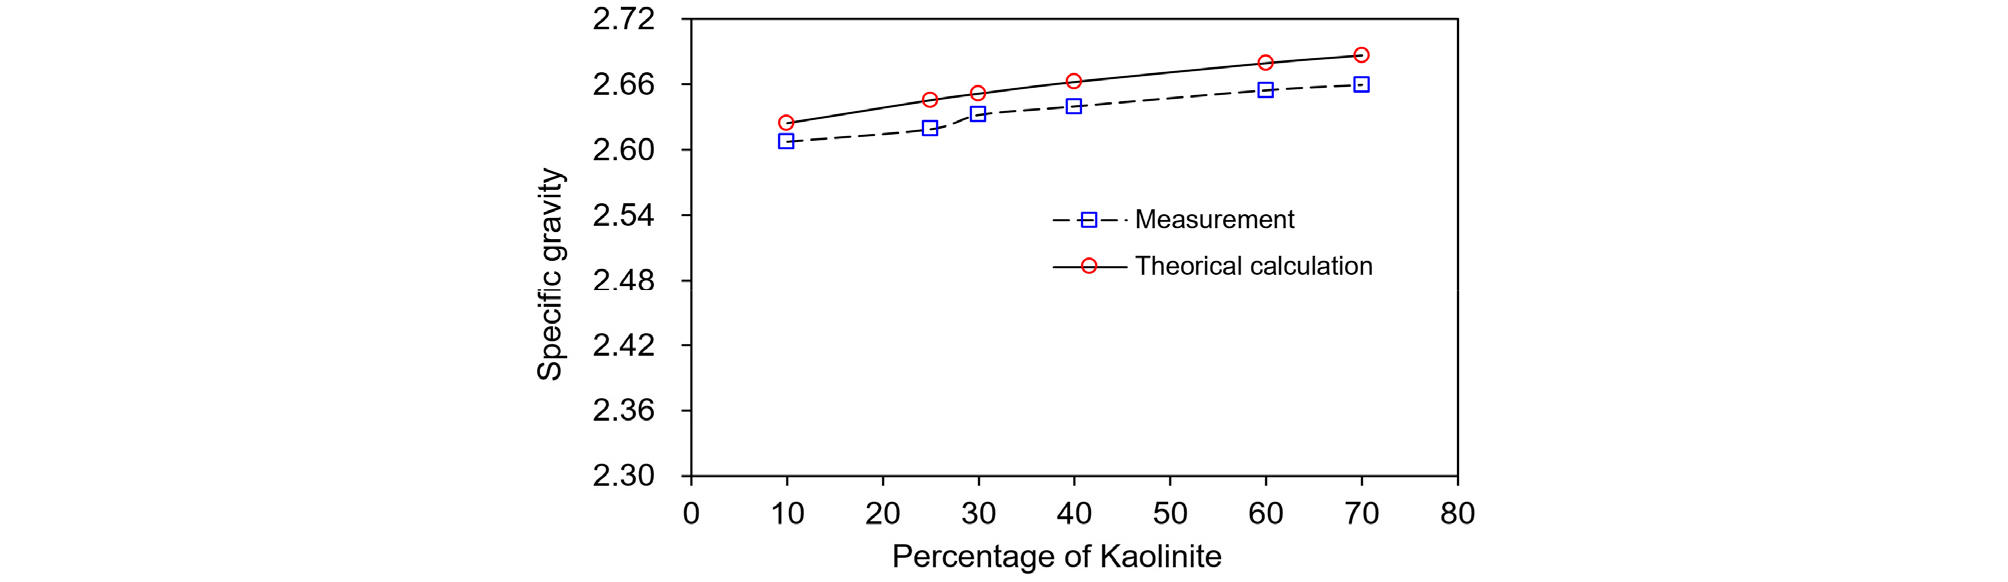
Table 3.
Comparison between measurement and theorical calculation
| KC (%) | Specific gravity | Error (%) | |
| Measurement | Theorical calculation | ||
| 10 | 2.608 | 2.625 | 0.65 |
| 25 | 2.619 | 2.646 | 1.01 |
| 30 | 2.632 | 2.652 | 0.74 |
| 40 | 2.640 | 2.662 | 0.84 |
| 60 | 2.655 | 2.679 | 0.93 |
| 70 | 2.659 | 2.686 | 1.02 |
4.2 Sieve analysis
The sieve analysis was conducted based on ASTM D-2487. After the dry sieving, wet sieving was performed for a considerable amount of soil retained on the No. 200 sieve. The grain size distributions for six mixtures were shown in Figure 2. The percentage of fine grains passing through No. 200 sieve were mostly the same to the percentage of kaolinite (KC) contents. As a result, the percentage of fine in the mixtures were 10.38, 26.33, 31.81, 41.31, 60.49, and 71.95%. Mathematically, The percentage finer than No. 200 sieve of the mixture (fc) could also be calculated since the percentage finer than No. 200 of CEN (fc,CEN) is approximately 0.35%. The formula in function of percentage finer than No. 200 sieve of CEN (fc,CEN) and Kaolinite (fc,KC) and the calculation results are shown in Equation 2 and Table 4.
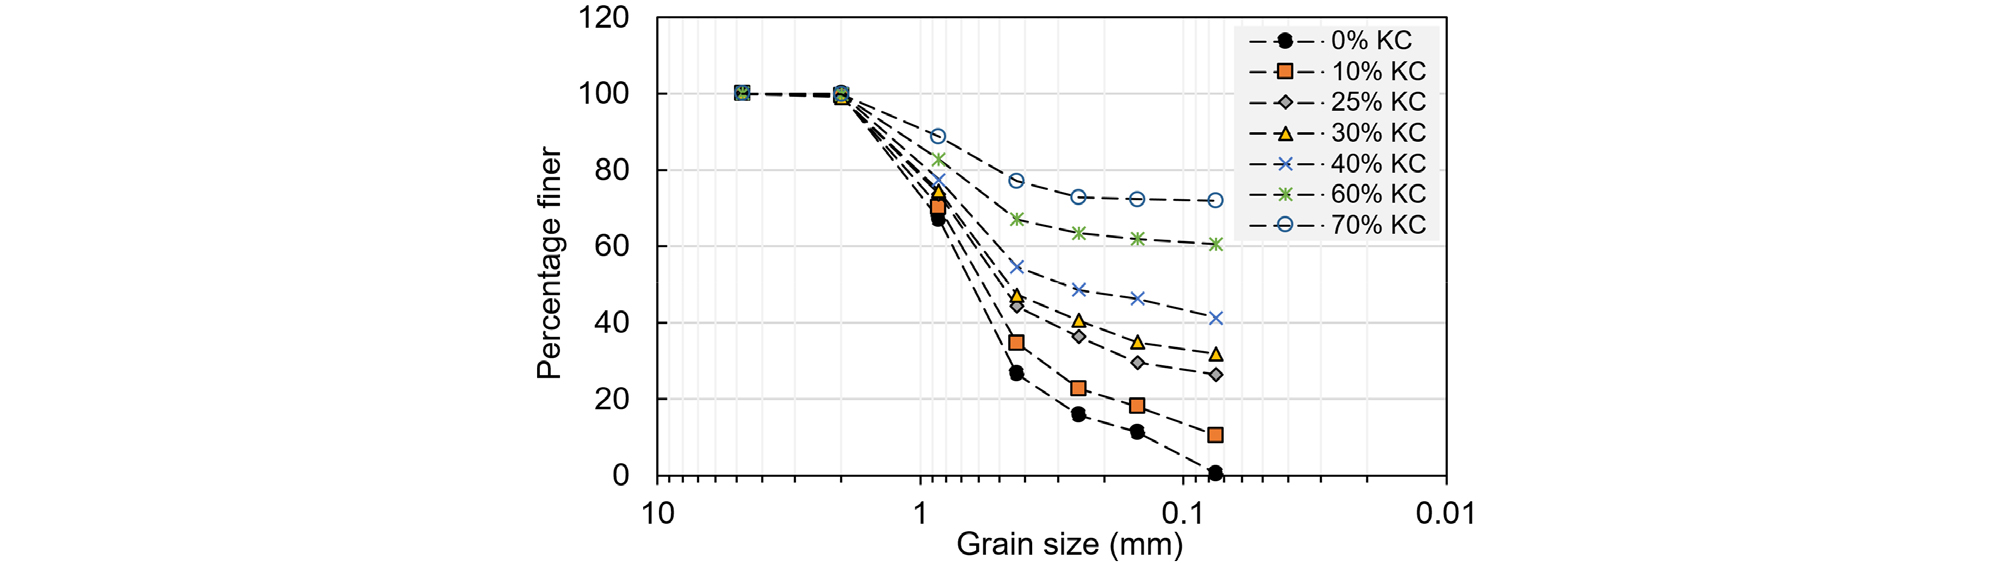
Table 4.
Comparison between measurement and theorical calculation
4.3 Atterberg limit
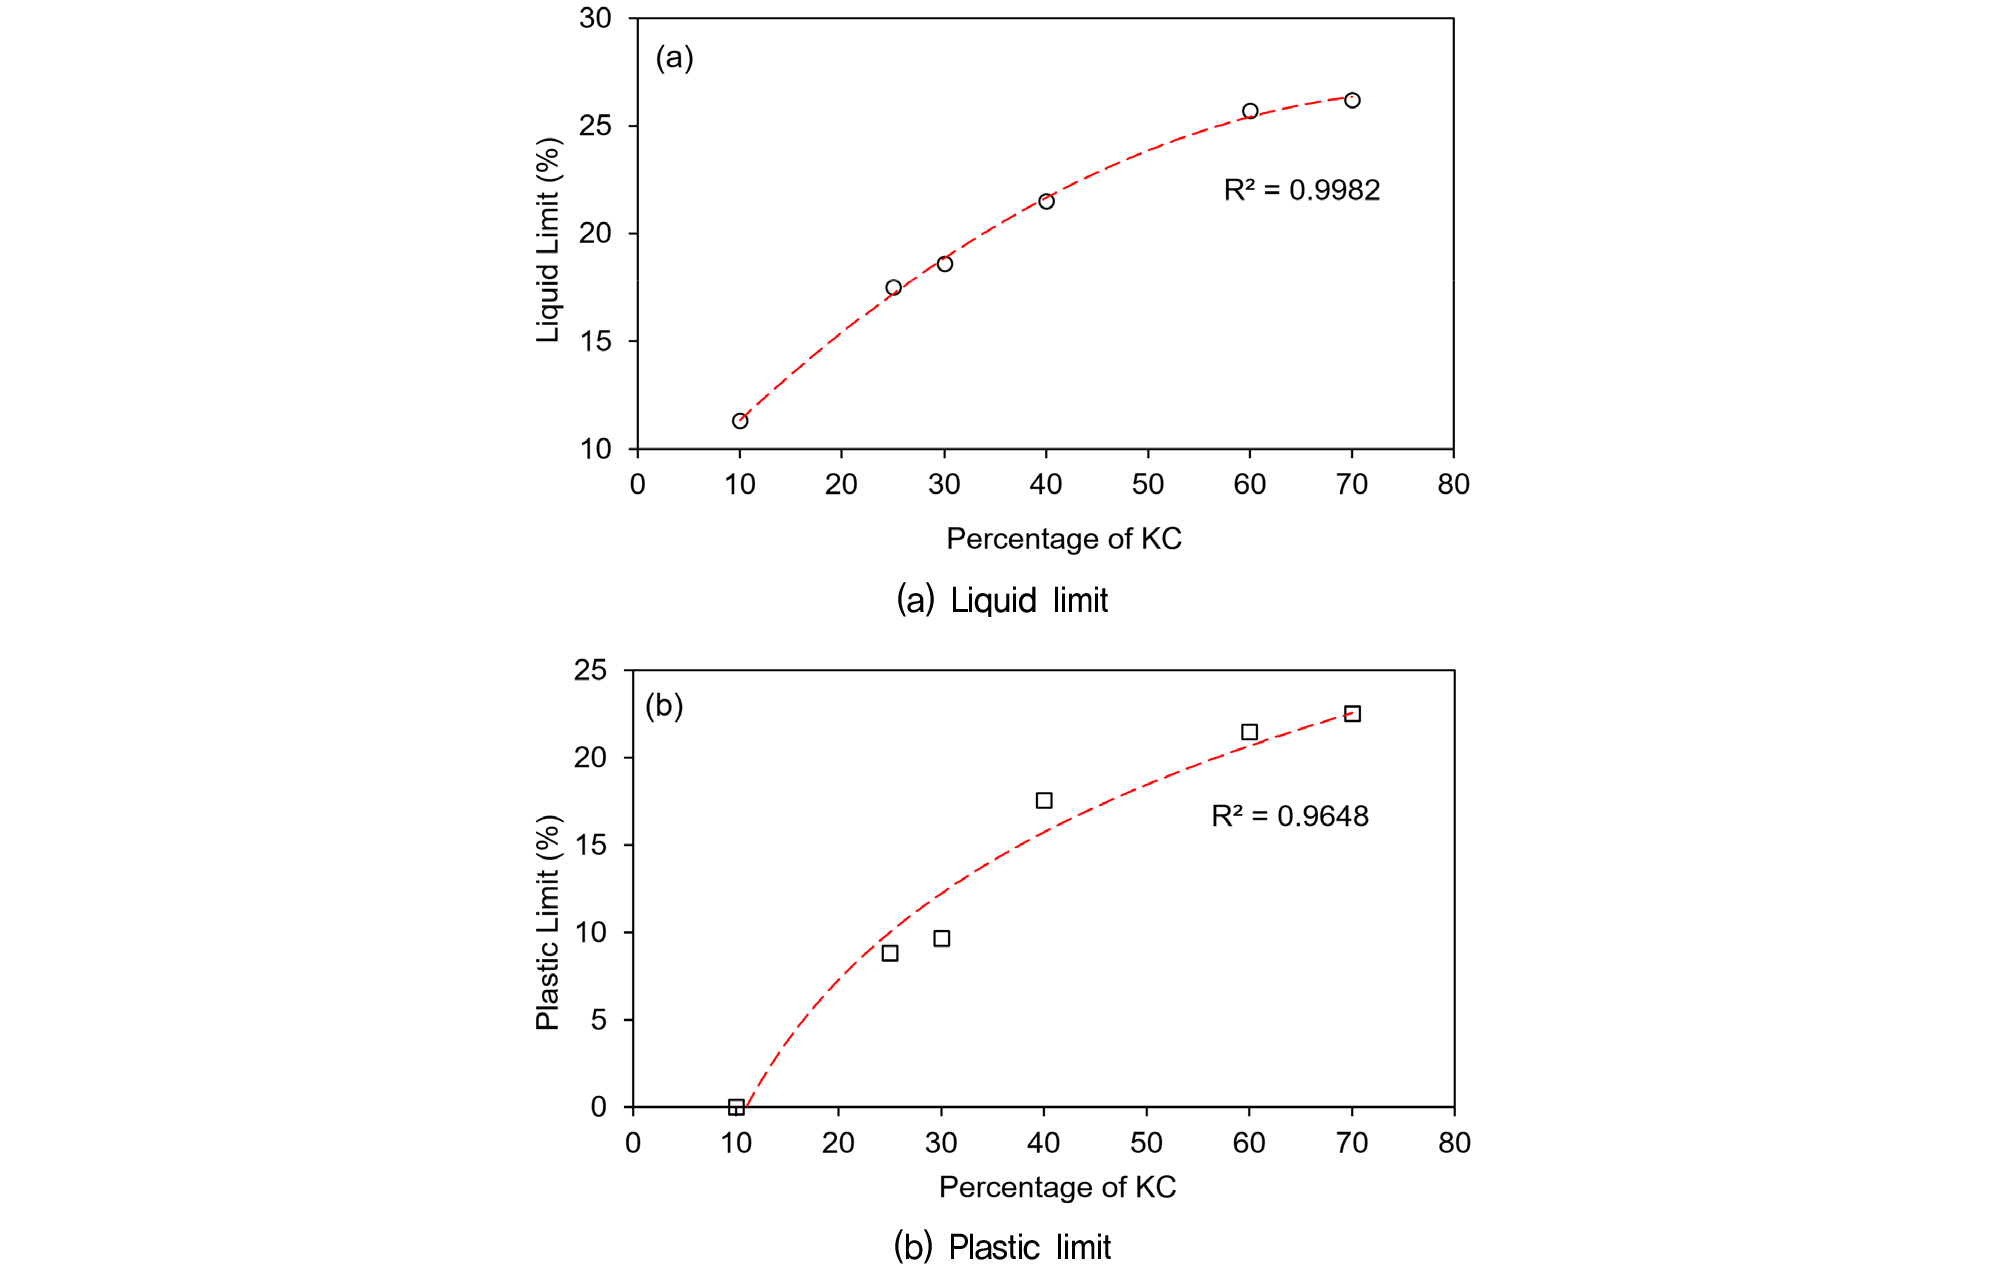
The Atterberg limit was measured on the prepared kaolinite-sand mixtures and the tests were based on ASTM D-4318. Figure 3 shows the experimental results of different mixtures in liquid limit and plastic limit test. It was observed that small amount of kaolinite (10%) could produce liquidity (LL = 11.3%) but was not enough to have a plasticity (PL = 0%). In overall, the values of LL and PL increased with the increase in percentage of KC because the higher amount of KC enabled the creation of a strong bonding structure which resulted in higher specific surface available for activities of kaolinite particles (Warkentin, 1972; Jyothi et al., 2019).
4.4 Compaction test
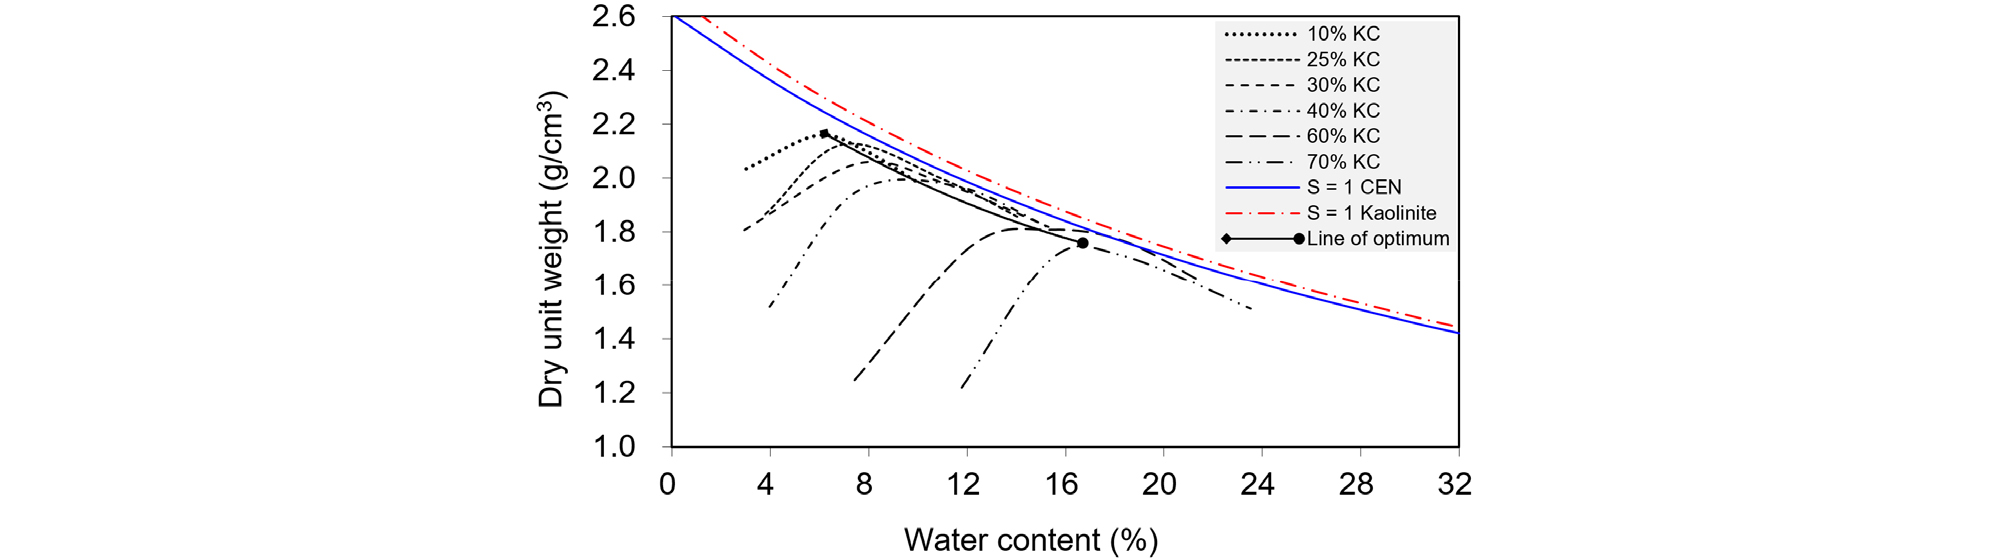
To observe the effect of fine content on the optimal water content (wopt) and the maximum dry unit weight (ɣd,max) of the mixtures, compaction tests were performed according to ASTM D-698 & D-1557 with method D. Figure 4 presents compaction curves of mixtures in terms of dry unit weight and water content. In overall, the experimental results showed that the curves move downward and right side with the increasing kaolinite content from 10 to 70%. In general, beyond a certain moisture content, any increase in the moisture content tends to reduce the dry unit weight. This is because the water takes up the space that would have been occupied by solid particles. Moreover, an increase in the amount of KC caused an increase in the percentage of water sorption (White and Pichler, 1959). Thus, the value of ɣd,max was found to decrease with the increase in the percentage of KC while the wopt increased with fine content. The global void ratio considering both granular and fine particles also increased with the increase of fine content because the value of void ratio was inversely proportional to the dry unit weight and the sand particles were regarded as the void when the coarse grains floating in fine grain network.
The results of index properties for all mixtures (10, 25, 30, 40, 60, 70% KC of CEN weight) were summarised as shown in Table 5.
Table 5.
Index properties of kaolinite-sand mixtures form fitting curves
Both results of plasticity index (PI) and liquid limit (LL) were used to categorize each mixtures according to the Casagrande chart (Figure 5) and the categorized result were summarized in Table 6.
Table 6.
Group symbol and name of all mixtures
| Material | Group symbol | Group name |
| KC10/CEN | SW-SC | Well-graded sand with clay |
| KC25/CEN | CL | Lean clay with sand |
| KC30/CEN | Sandy lean clay | |
| KC40/CEN | CL-ML | Sandy silty clay |
| KC60/CEN | ||
| KC70/CEN | ML | Sandy silt |

4.5 Microscopic image analysis
The observation of microscopic images on all cases of mixtures (Figure 7) clearly illustrated the micromechanical effect of kaolinite clay even for a low percentage of KC. The blue solid line and the red dashed line represent the kaolinite and CEN standard sand, respectively.
Figure 6a shows the microstructure of KC10/CEN mixture which was categorized as a type of low fine content or sand dominant because there were no kaolinite particles surrounding sand particles. As the fine content increases up to 25% (KC25/CEN), the presence of kaolinite was started to surround sand particles (Figure 6b). In case of KC30/CEN (Figure 6c), the micromechanics was not much different from KC25/CEN. Surprisingly, by adding more 10% of kaolinite (KC40/CEN), fine sand particles started to be surrounded by the KC, but the coarse-grained sand particles (Figure 6d) were not surrounded yet. With 60% of KC (KC60/CEN), the present of KC was found all over the small and large particles of CEN standard sand (Figure 6e). Moreover, in case of KC70/CEN (Figure 6f), it had high fine content and could be categorized as the fine dominant mixture. In this mixture, it was difficult to identify particles from CEN sand particles.
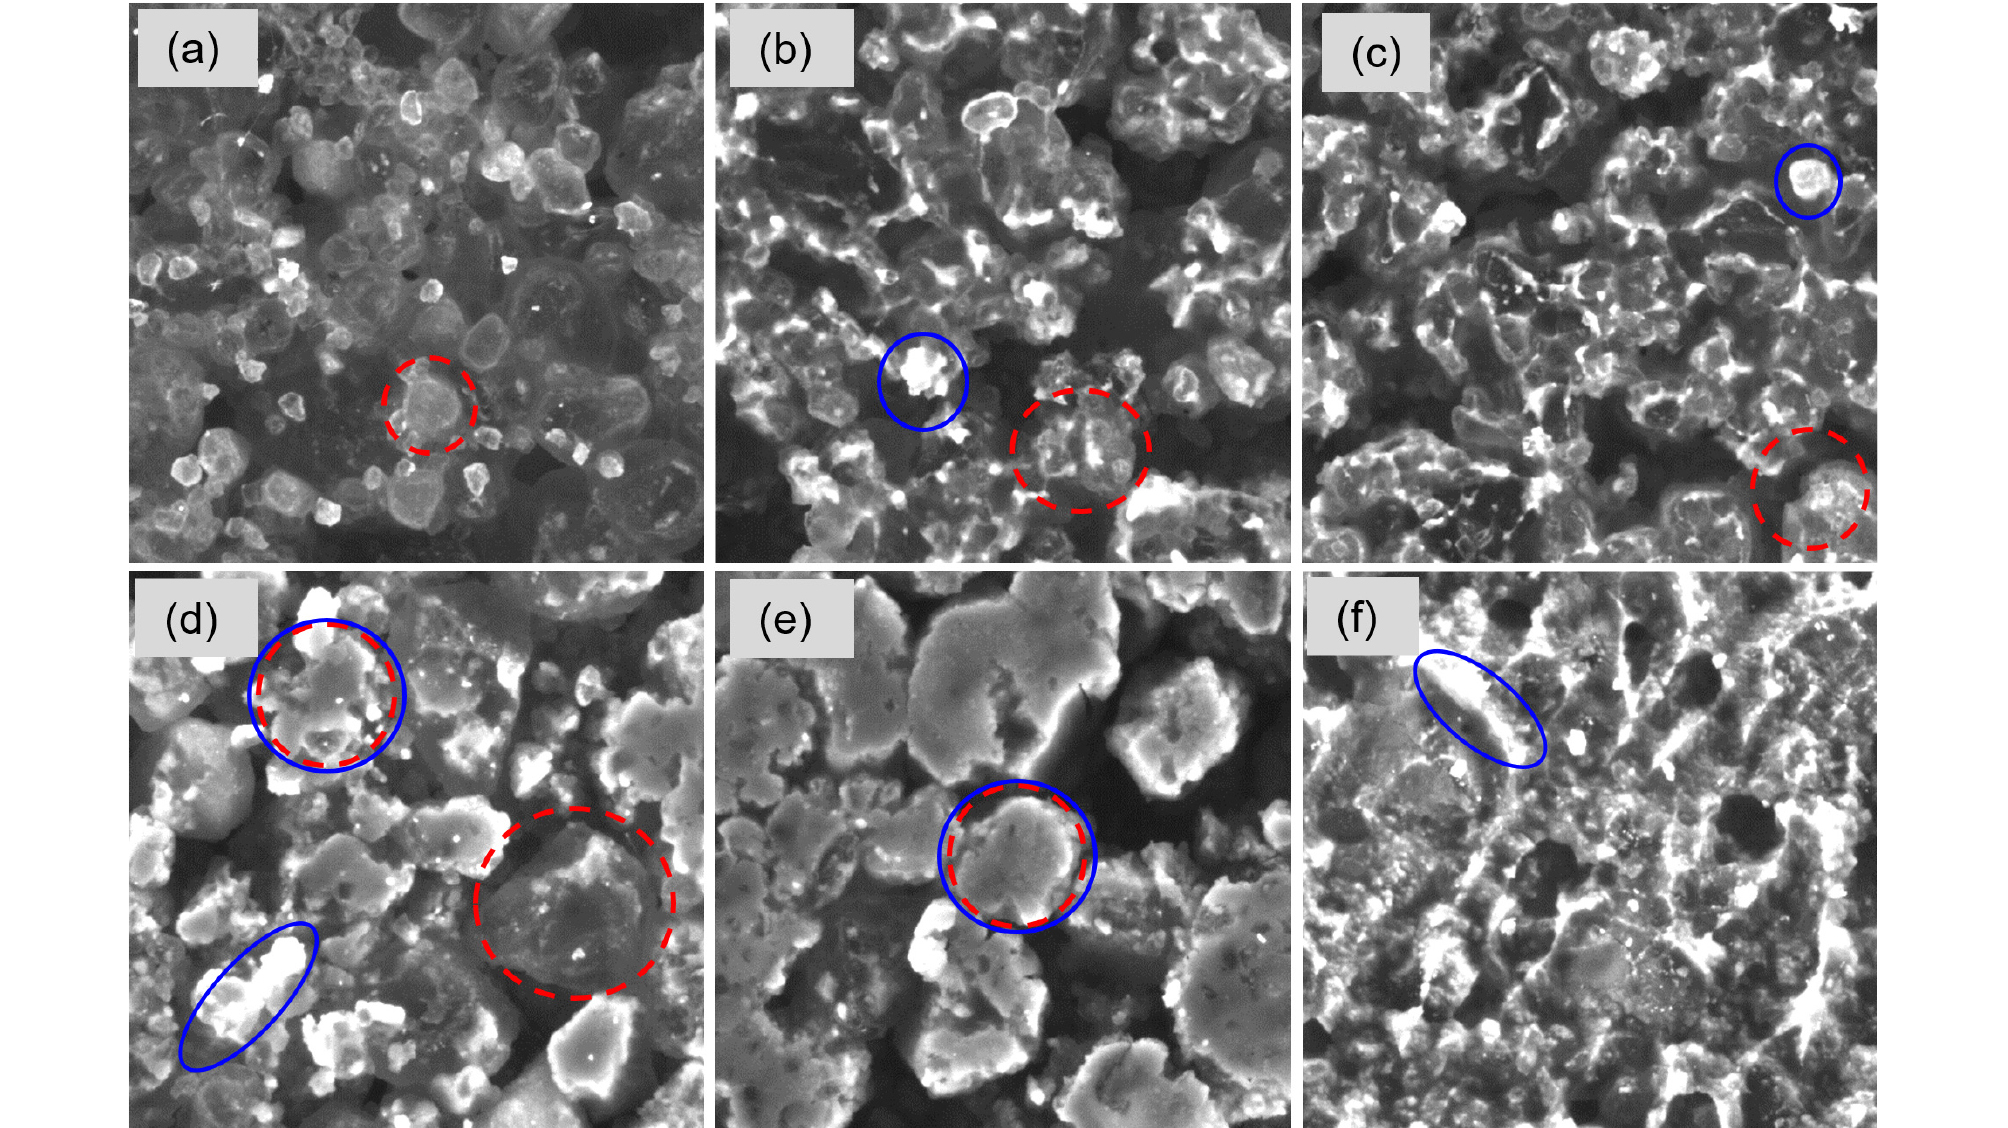
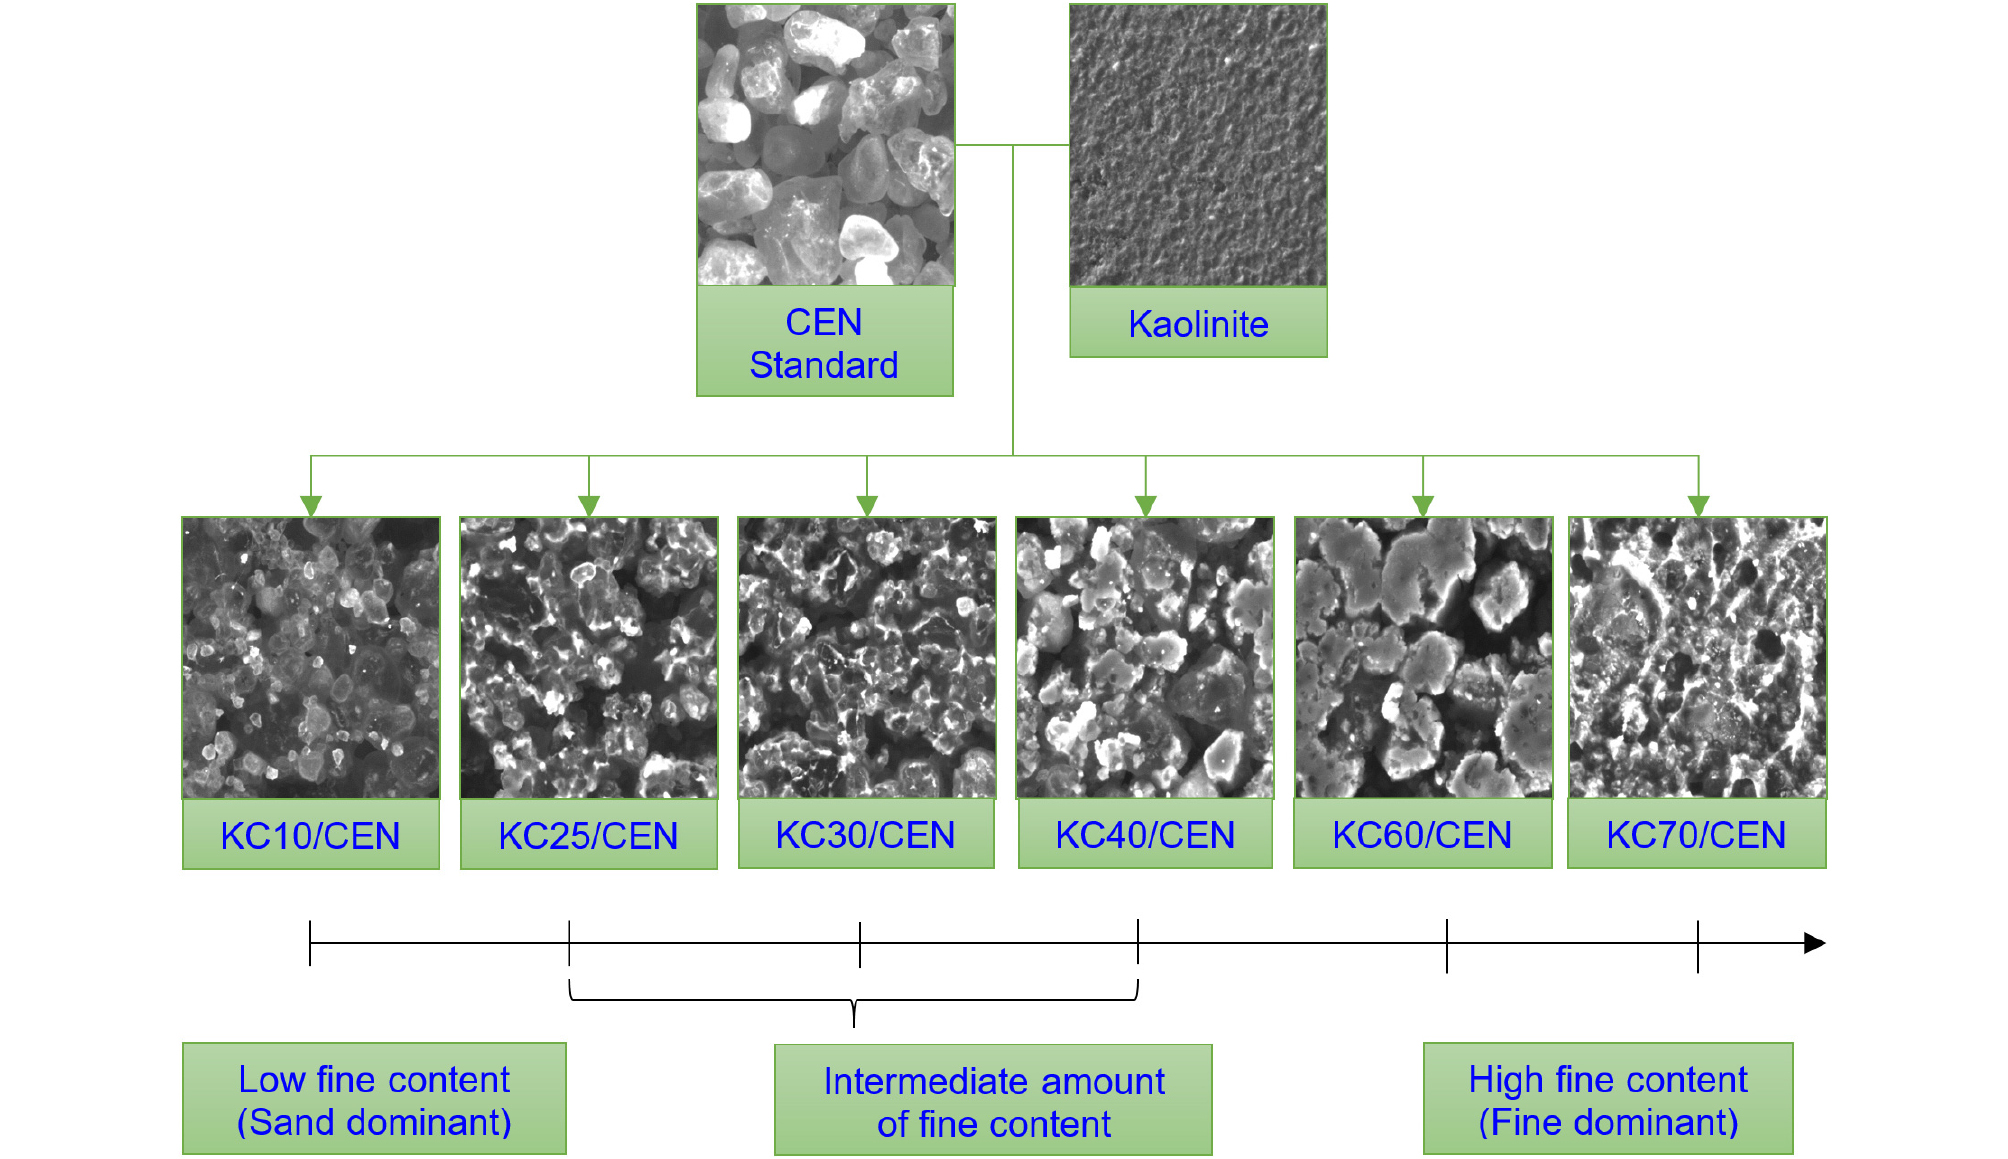
Figure 7 shows the types of the mixture based on various proportion of kaolinite. The first mixture having the lowest fine content (KC10/CEN) could be classified as sand dominant mixture. In this mixture, the KC particles were still floating in the void and the movement (e.g., deformation and settlement) of mixture under the pressure was dominated by sand particles (Chang and Meidani, 2013). With increasing fine content, the next three mixtures (KC25/CEN, KC30/CEN, and KC40/CEN) could be categorized as intermediate fine content mixtures. At this percentage of fine content, the KC particles partially interacted with sand particles and the transition fine content could be found within this range (Monkul and Ozden, 2005). Moreover, the deformation of mixture was controlled by both KC and sand particles (Chang and Meidani, 2013). The high fine content mixtures (KC60/CEN and KC70/CEN) were fine dominant mixtures. In this type of mixture, the high amount of fine particles were dominant in the grain network. The deformation was also large compared to the other mixtures since the behaviour of mixture is fully controlled by fine particles of kaolinite (Chang and Meidani, 2013).
Based on the image analysis of the microphotographs, the fine and coarse grains seemed to interact well in the range from 25 to 40% of fine content. Also, it was consistent with many previous studies (Vaid, 1994; Pitman et al., 1994; Lade and Yamamuro, 1997; Amini and Qi, 2000; Chien et al., 2002; Monkul and Ozden, 2007) which mentioned that these percentage of KC could stabilize the soil and control the overall engineering behaviour of soil.
5. Conclusions
The effects of fine content on physical properties of sand and clay mixtures were studied for various proportions of kaolinite clay by basic property test, compaction test, and microscopic image analysis. With the increase of fine content from 10 to 70%, liquid limit, plastic limit and wopt increased whereas ɣd,max decreased. Based on the microscopic image analysis, the transition from sand dominant mixture to fine dominant mixture could be clearly observed. The findings in the current study can be useful in various geotechnical engineering problems, especially, when it is inevitable to use natural sandy soils with high fine content, in order to predict whether the finer or coarser grain matrix controls the overall engineering behaviour.