Journal of the Korean Geotechnical Society. 31 March 2016. 15-27
https://doi.org/10.7843/kgs.2016.32.3.15

ABSTRACT


MAIN

  • 1. 서 론

  • 2. 암반의 파괴기준

  •   2.1 Mohr-Coulomb 파괴기준

  •   2.2 Hoek-Brown 파괴기준

  • 3. 제주도 현무암의 삼축압축시험

  • 4. 삼축압축시험 결과에 대한 분석 및 고찰

  • 5. 결 론

1. 서 론

우리나라의 화산활동은 중생대의 중성 내지 산성 화산암류의 분출과 신생대의 현무암의 분출로 크게 구분된다. 중생대의 화산암은 옥천대 및 경상분지 내에 주로 분포하고, 제3기 후기와 제4기의 신생대 화산활동은 제주도, 울릉도, 철원~전곡 일대, 포항분지의 구룡포 일대에서 일어났다(KGS, 2012). 이중에서 제주도는 약 200만 년 전부터 역사시대까지 발생한 여러 차례의 화산활동에 의해 형성된 섬으로(Yoon and Ko, 2011), 제주도의 화산암은 지역마다 지질특성이 다양하며, 그 역학적 특성 또한 지역마다 차이를 나타내고 있다. 특히 용암이 분출할 때 마그마에 작용하던 압력이 낮아짐에 따라 그 속에 존재하던 가스가 표면으로 올라오면서 형성된 기공들은 마그마의 점성을 비롯한 여러 환경요소로 인하여 그 크기와 분포가 다양하게 형성되어 있다.

제주도 화산암은 다공성 구조인 현무암과 같은 특수한 지질학적 조건을 갖고 있으며, 기반암은 육지부와 달리 현무암층 사이에 연약층인 화산쇄설물 및 공동이 불규칙하게 발달된 층상구조로 이루어져 있기 때문에, 이전부터 대규모 토목공사 및 지하수 개발에 있어서 수많은 시행착오를 경험하고 있다(Kim, 2006). 뿐만 아니라 최근에 건설되고 있는 육상 및 해상 풍력발전시스템의 기초공사와 향후 건설예정인 대규모의 토목공사에 대비하여 제주도 암반지반에 대한 공학적 관점에서의 물리적 및 역학적 특성에 대한 심도 깊은 연구가 요구되고 있는 실정이다.  

현재까지 제주도 화산암에 대한 지구물리학, 지구지질학적 관점에서의 지질학적, 화학적 특성에 대한 연구로부터 제주도의 지질개관, 형성과정 및 암석학적 특성 등이 정립되었다. 반면, 제주도 화산암에 대한 공학적 관점에서의 물리적 및 역학적 특성에 관한 연구는 몇몇의 연구자에 의해 이루어져 왔지만, 대부분의 연구가 특정 지역의 암석에 대한 물성 및 역학적 특성만을 비교 분석하는데 그치고 있으며(Kim and Choi, 1991; Eum, 2002; Kim, 2006; Nam et al., 2008a,b; Cho et al., 2009; Moon et al., 2014), 제주도 화산암에 대한 물리적 특성 및 역학적 특성에 대한 종합적인 비교 분석은 Yang (2014)에 의해 처음으로 이루어졌다. 그러나 위의 연구들은 대부분 암석의 일축압축강도 특성만을 다루고 있다.

제주도 현무암에 대한 삼축압축시험의 결과를 이용한 연구는 Kim(2006)과 Nam et al.(2009)에 의해, 제주도 서귀포시 성산읍 삼달리 일대에서 채취한 표선리 현무암, 조면암질 현무암, 스코리아에 대하여 처음으로 이루어졌으며, 각각의 암석에 대한 Mohr-Coulomb 파괴기준과 Hoek-Brown 파괴기준을 비교하고 있다. 그리고 Yang(2015b)은 제주도 북동부 육해상, 남동부 해상 및 북서부 해상에서 채취한 현무암 암석에 대한 삼축압축시험 결과와 Kim(2006)과 Nam et al.(2009)의 연구결과를 이용하여, 현무암의 다공성 구조를 나타내는 파라미터인 흡수율과 Mohr-Coulomb 파괴기준의 파라미터인 점착력과 내부 마찰각과의 관계 및 그 특성을 각각 살펴보고, 제주도 현무암의 점착력과 내부 마찰각을 추정하기 위한 회귀 관계식을 제안하고 있다.

암반역학에서 이용되고 있는 Hoek-Brown 파괴기준은 Mohr-Coulomb 파괴기준과 함께 자주 이용되고 있는 파괴기준이며, 암석(intact rock)과 암반(rock mass)에 적용할 수 있는 경험적 모델이다. 이 파괴기준에서는 다양한 암석에 대한 Hoek-Brown 계수 http://static.apub.kr/journalsite/sites/kgs/2016-032-03/N0990320302/images/PICE52A.gif 및 지질강도지수(Geological Strength Index, GSI)를 이용하여 암반의 강도정수를 추정하기 위한 관계식이 제시되어 있으며, 암석에 대한 실내시험이 불가능 할 경우 이 파괴기준에서 제시되어 있는 도표를 이용하여 초기설계를 수행할 수 있는 이점이 있다. 그러나 Hoek-Brown 파괴기준에서 제시된 다양한 암석에 대한 Hoek-Brown의 계수 http://static.apub.kr/journalsite/sites/kgs/2016-032-03/N0990320302/images/PICE53A.gif의 경우, 특히 현무암과 관련하여 일축압축강도가 100MPa 이상인 경암에서 극경암에 해당하는 현무암 암석에 대한 추정된 값만이 제시되어 있다(Hoek and Brown, 1997; Marinos and Hoek, 2000; 2001).

한편 제주도 현무암의 경우 암석의 공극 상태에 따라 연암에서 극경암까지 다양하게 분포하고 있으며(Yang, 2014; 2015a), 제주도에 널리 분포하고 있는 현무암 암반에 대한 좀 더 정확한 초기설계를 수행하기 위하여 제주도 현무암 암석에 대한 Hoek-Brown의 계수 http://static.apub.kr/journalsite/sites/kgs/2016-032-03/N0990320302/images/PICE54B.gif를 제시할 필요가 있다고 사료된다.

따라서 본 연구에서는 제주도 북동부 육해상, 남동부 해상 및 북서부 해상에서 채취한 현무암 암석에 대한 삼축압축시험 결과와 Kim(2006)과 Nam et al.(2009)의 연구결과를 이용하여, 제주도 현무암에 대한 Hoek-Brown 파괴기준에서 이용되는 암석 계수 http://static.apub.kr/journalsite/sites/kgs/2016-032-03/N0990320302/images/PICE55B.gif의 특성 및 적절한 특성값을 살펴보고, Mohr-Coulomb 파괴기준으로부터 산정된 점착력 및 내부 마찰각과 Hoek-Brown 파괴기준으로부터 추정된 점착력 및 내부 마찰각을 각각 비교 분석하고자 한다.

2. 암반의 파괴기준

2.1 Mohr-Coulomb 파괴기준

http://static.apub.kr/journalsite/sites/kgs/2016-032-03/N0990320302/images/figure_KGS_32_03_02_F1.jpg

Fig. 1. Mohr-Coulomb failure criterion in terms of normal and shear stresses

암반역학에서 사용되는 파괴기준들 중의 하나인 Mohr- Coulomb 파괴기준은 수식이 단순하며, 이해하기 쉽고, 간단하게 사용할 수 있기 때문에 자주 사용되고 있다. 적어도 3개 이상의 서로 다른 구속압력 아래에서 이루어진 삼축압축시험 결과를 Fig. 1에 나타낸 것과 같이 수직응력과 전단응력 평면상에 Mohr원을 나타냄으로써, Mohr-Coulomb 파괴 포락선과 인장강도를 나타내는 최대인장기준선을 결정할 수 있다. 여기서 Mohr-Coulomb 파괴 포락선은 식 (1)과 같이 나타낼 수 있다.

http://static.apub.kr/journalsite/sites/kgs/2016-032-03/N0990320302/images/PICE5D9.gif (1)

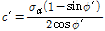
여기서, http://static.apub.kr/journalsite/sites/kgs/2016-032-03/N0990320302/images/PICE609.gif는 전단 파괴면을 따라 발생하는 전단응력 또는 전단강도, http://static.apub.kr/journalsite/sites/kgs/2016-032-03/N0990320302/images/PICE62A.gif는 점착력, http://static.apub.kr/journalsite/sites/kgs/2016-032-03/N0990320302/images/PICE63A.gif은 전단면에 작용하는 유효 수직응력, 그리고 http://static.apub.kr/journalsite/sites/kgs/2016-032-03/N0990320302/images/PICE66A.gif는 내부 마찰각을 의미한다.

또한 Mohr-Coulomb 파괴기준은 식 (2)와 같이 최대 유효 주응력 http://static.apub.kr/journalsite/sites/kgs/2016-032-03/N0990320302/images/PICE67B.gif과 최소 유효 주응력 http://static.apub.kr/journalsite/sites/kgs/2016-032-03/N0990320302/images/PICE69B.gif와의 관계로 표현할 수 있으며, 식 (2)는 식 (3)과 같이 다시 쓸 수 있다. 식 (3)을 그래프로 나타내면 Fig. 2와 같다.

http://static.apub.kr/journalsite/sites/kgs/2016-032-03/N0990320302/images/figure_KGS_32_03_02_F2.jpg

Fig. 2. Mohr-Coulomb failure criterion in terms of principal stresses

Table 1. Field estimations of uniaxial compressive strength of intact rock (Marinos and Hoek, 2000; 2001)

Grade*

Term

Uniaxial compressive strength (MPa)

Point load index

(MPa)

Field estimate of strength

Examples

R6

Extremely strong

>250

>10

Specimen can only be chipped with a geological hammer

Fresh basalt, chert, diabase, gneiss, granite, quartzite

R5

Very 

strong

100 ~ 250

4 ~ 10

Specimen requires many blows of a geological hammer to fracture it

Amphibolite, sandstone, basalt, gabbro, gneiss, granodiorite, peridotite, rhyolite, tuff

R4

Strong

50 ~ 100

2 ~ 4

Specimen requires more than one blow of a geological hammer to fracture it

Limestone, marble, sandstone, schist

R3

Medium strong

25 ~ 50

1 ~ 2

Cannot be scraped or peeled with a pocket knife, specimen can be fractured with a single blow from a geological hammer

Concrete, phyllite, schist, siltstone

R2

Weak

5 ~ 25

**

Can be peeled with a pocket knife with difficulty, shallow indentation made by firm blow with point of geological hammer

Chalk, claystone, potash, marl, siltstone, shale, rock salt

R1

Very 

Weak

1 ~ 5

**

Crumbles under firm blows with point of a geological hammer, can be peeled by a pocket knife

Highly weathered or altered rock, shale

R0

Extremely weak

0.25 ~ 1

**

Indented by thumbnail

Stiff fault gouge

 *Grade according to Brown (1981)

**Point load tests on rocks with a uniaxial compressive strength below 25 MPa are likely to yield highly ambiguous results.

http://static.apub.kr/journalsite/sites/kgs/2016-032-03/N0990320302/images/PICE757.gif (2)

http://static.apub.kr/journalsite/sites/kgs/2016-032-03/N0990320302/images/PICE787.gif (3)

여기서, http://static.apub.kr/journalsite/sites/kgs/2016-032-03/N0990320302/images/PICE798.gif는 암석의 일축압축강도, http://static.apub.kr/journalsite/sites/kgs/2016-032-03/N0990320302/images/PICE7A9.gif는 최소 유효 주응력과 최대 유효 주응력 사이의 관계를 나타내는 직선의 기울기를 의미한다. 그리고 내부 마찰각과 점착력은 다음의 식 (4)와 식 (5)를 이용하여 각각 계산할 수 있다.

http://static.apub.kr/journalsite/sites/kgs/2016-032-03/N0990320302/images/PICE7C9.gif (4)

http://static.apub.kr/journalsite/sites/kgs/2016-032-03/N0990320302/images/PICE856.gif (5)

2.2 Hoek-Brown 파괴기준

Hoek-Brown 파괴기준은 Hoek and Brown(1980)에 의해 처음 발표된 이후 계속 수정되어오고 있으며, 암석 뿐만 아니라 암반에도 적용할 수 있는 경험적 모델로써, Hoek et al.(1995)과 Hoek and Brown(1997)에 의해 식 (6)과 같은 일반화된 Hoek-Brown 파괴기준(Generalized Hoek-Brown failure criterion)이 제안되었다.

http://static.apub.kr/journalsite/sites/kgs/2016-032-03/N0990320302/images/PICE8A6.gif (6)

여기서, http://static.apub.kr/journalsite/sites/kgs/2016-032-03/N0990320302/images/PICE8B6.gif는 암석의 일축압축강도를 의미하며, 실내시험을 통하여 얻을 수 있다. 그러나 실내시험을 수행하지 못할 경우에는 Table 1에 나타낸 값을 이용할 수 있다. 그러나 Table 1에 나타낸 현무암에 대한 일축압축강도의 경우 100MPa 이상으로, ISRM(1981)의 일축압축강도에 따른 암석의 분류에 따르면 경암에서 극경암에 해당하는 암석에 대한 강도이며, Yang(2014, 2015a)에 의하면 제주도 현무암의 경우 암석의 공극 상태에 따라 연암에서 극경암까지 다양하게 분포하고 있다.

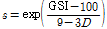
그리고 식 (6)의 암반 계수 http://static.apub.kr/journalsite/sites/kgs/2016-032-03/N0990320302/images/PICE8C7.gif, http://static.apub.kr/journalsite/sites/kgs/2016-032-03/N0990320302/images/PICE8D7.gifhttp://static.apub.kr/journalsite/sites/kgs/2016-032-03/N0990320302/images/PICE8D8.gif는 암반의 종류와 불연속면의 발달 정도에 따라 달라지는 계수로써, 지질강도지수(Geological Strength Index, GSI)를 이용하여 추정할 수 있다. http://static.apub.kr/journalsite/sites/kgs/2016-032-03/N0990320302/images/PICE8E9.gifhttp://static.apub.kr/journalsite/sites/kgs/2016-032-03/N0990320302/images/PICE8FA.gif를 추정하는 관계식의 경우 GSI 값이 25 전후에서 다른 식으로 정의되었었으나(Hoek et al., 1995; Hoek and Brown, 1997), Hoek et al.(2002)에 의해 GSI 값과 암반의 교란의 정도를 나타내기 위해 새롭게 도입된 계수 http://static.apub.kr/journalsite/sites/kgs/2016-032-03/N0990320302/images/PICE90A.gif를 이용하여 암반계수 http://static.apub.kr/journalsite/sites/kgs/2016-032-03/N0990320302/images/PICE91B.gif, http://static.apub.kr/journalsite/sites/kgs/2016-032-03/N0990320302/images/PICE92C.gifhttp://static.apub.kr/journalsite/sites/kgs/2016-032-03/N0990320302/images/PICE92D.gif를 추정할 수 있는 관계식이 식 (7)~(9)와 같이 제안되었다. 여기서, http://static.apub.kr/journalsite/sites/kgs/2016-032-03/N0990320302/images/PICE93D.gifhttp://static.apub.kr/journalsite/sites/kgs/2016-032-03/N0990320302/images/PICE95D.gif를 추정하는 관계식의 경우, 이전에 제시된 식과 달리 연속적으로 계산할 수 있게 되었다는 것이 특징적이다. 그리고 암반의 교란의 정도를 나타내는 계수 http://static.apub.kr/journalsite/sites/kgs/2016-032-03/N0990320302/images/PICE97E.gif의 값은 불교란 암반인 경우의 0인 값에서 매우 교란이 심한 암반인 경우의 1인 값 사이에서 변하며, 이에 대한 자세한 내용은 Hoek et al.(2002)를 참조하기 바란다.

http://static.apub.kr/journalsite/sites/kgs/2016-032-03/N0990320302/images/PICE9BD.gif (7)

http://static.apub.kr/journalsite/sites/kgs/2016-032-03/N0990320302/images/PICE9ED.gif (8)

http://static.apub.kr/journalsite/sites/kgs/2016-032-03/N0990320302/images/PICEA5B.gif (9)

식 (7)에서 http://static.apub.kr/journalsite/sites/kgs/2016-032-03/N0990320302/images/PICEA6C.gif는 암석에 대한 Hoek-Brown 계수를 의미하며, 암석의 삼축압축시험 결과를 이용하여 식 (10)에 나타낸 것과 같이 http://static.apub.kr/journalsite/sites/kgs/2016-032-03/N0990320302/images/PICEA9C.gifhttp://static.apub.kr/journalsite/sites/kgs/2016-032-03/N0990320302/images/PICEAEB.gif의 상관관계로부터 구할 수 있다. 그러나 실내시험을 수행할 수 없을 경우에는 Table 2에 나타낸 다양한 암석에 대한 http://static.apub.kr/journalsite/sites/kgs/2016-032-03/N0990320302/images/PICEB0B.gif 값을 이용할 수 있다. 그리고 Table 2에 나타낸 http://static.apub.kr/journalsite/sites/kgs/2016-032-03/N0990320302/images/PICEB1C.gif 값은 이전 버전과 달리 많은 부분에서 수정이 이루어졌으며, 여기서 특히 주목해야 할 점은 현무암의 경우 이전에 제시된 버전의 값인 (17)에서 (25±5)로 값이 달라졌다는 것이며, 괄호 안의 값은 추정된 값임을 의미한다. 그리고 식 (10)의 Y절편 http://static.apub.kr/journalsite/sites/kgs/2016-032-03/N0990320302/images/PICEB2D.gif의 값은 암석의 경우 통상적으로 1이라고 가정된다.

http://static.apub.kr/journalsite/sites/kgs/2016-032-03/N0990320302/images/PICEBF9.gif (10)

Table 2. Values of the constant http://static.apub.kr/journalsite/sites/kgs/2016-032-03/N0990320302/images/PIC7B4D.gif for intact rock, by rock group (Marinos and Hoek, 2000; 2001)

Rock type

Class

Group

Texture

Coarse

Medium

Fine

Very fine

http://static.apub.kr/journalsite/sites/kgs/2016-032-03/N0990320302/images/PIC7DCE.gif

Clastic

Conglomerates

*

Sandstones

17±4

Siltstones

7±2

Claystones

4±2

Breccias

*

Greywackes

(18±3)

Shales

(6±2)

Marls

(7±2)

Non-

Clastic

Carbonates

Crystalline

Limestone

(12±3)

Sparitic

Limestones

(10±2)

Micritic

Limestones

(9±2)

Dolomites

(9±3)

Evaporites

Gypsum

8±2

Anhydrite

12±2

Organic

Chalk

7±2

http://static.apub.kr/journalsite/sites/kgs/2016-032-03/N0990320302/images/PIC7EE9.gif

Non Foliated

Marble

9±3

Hornfels

(19±4)

Metasandstone

(19±3)

Quartzites

20±3

Slightly foliated

Migmatite

(29±3)

Amphibolites

26±6

Gneiss

28±5

Foliated**

Schists

12±3

Phyllites

(7±3)

Slates

7±4

http://static.apub.kr/journalsite/sites/kgs/2016-032-03/N0990320302/images/PIC8013.gif

Plutonic

Light

Granite

 32±3

Diorite

25±5

Granodiorite

(29±3)

Dark

Gabbro

 27±3

Dolerite

(16±5)

Norite

20±5

Hypabyssal

Porphyries

(20±5)

Diabase

(15±5)

Peridotite

(25±5)

Volcanic

Lava

Rhyolite

(25±5)

Andesite

25±5

Dacite

(25±3)

Basalt

(25±5)

Pyroclastic

Agglomerate

(19±3)

Breccia

(19±5)

Tuff

(13±5)

 *Conglomerates and breccias may present a wide range of mi values depending on the nature of the cementing material and the degree of cementation, so they may range from values similar to sandstone, to values used for fine grained sediments (even under 10).

**These values are for intact rock specimens tested normal to bedding or foliation. The value of mi will be significantly different if failure occurs along a weakness plane.

Notes) Values in parenthesis are estimates. The range of values quoted for each material depend upon the granularity and interlocking of the crystal structure: the higher values being associated with tightly interlocked and more frictional characteristics.

식 (7)~(9)에서 사용되는 GSI는 암반에 대하여 Hoek- Brown 파괴기준을 적용하기 위하여 도입된 암반의 상태를 나타내기 위한 값으로서 Table 3에 나타내었다.
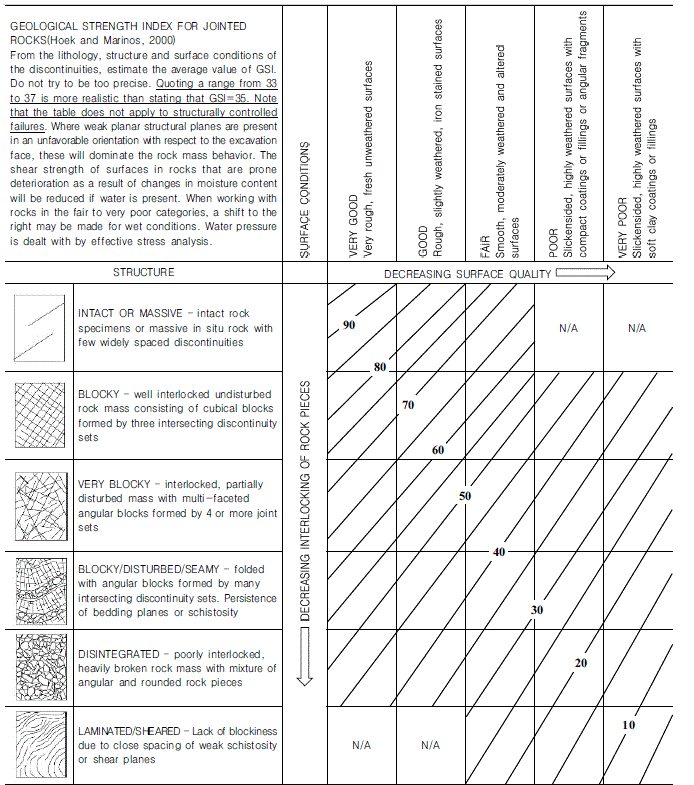
Table 3. Geological strength index for jointed rock masses (Marinos and Hoek, 2000)

http://static.apub.kr/journalsite/sites/kgs/2016-032-03/N0990320302/images/img_3.GIF

3. 제주도 현무암의 삼축압축시험

제주 광역경제권 선도사업 R&D사업의 제주 해역 특성에 적합한 해상풍력발전기의 설치를 위한 지반설계기술 개발의 일환으로, 2012년에서 2014년까지 약 3년간에 걸쳐 제주도 북동부 육해상, 남동부 해상, 북서부 해상에 대하여 시추가 이루어졌으며(Fig. 3), 채취된 암석에 대한 구성광물과 조성을 파악하기 위한 편광현미경 및 X-선 회절 분석, 그리고 KS 및 ASTM 시험규정에 입각한 다양한 물성시험 및 강도시험이 수행되었다.

편광현미경 및 X-선 회절 분석 결과, 제주도 북동부 육해상과 남동부 해상에서 채취된 암석의 경우 감락석을 일부 포함하고 있지만, 채취된 암석들의 주요 구성광물은 사장석과 휘석으로써 현무암에 해당하였다(Yang, 2015b).

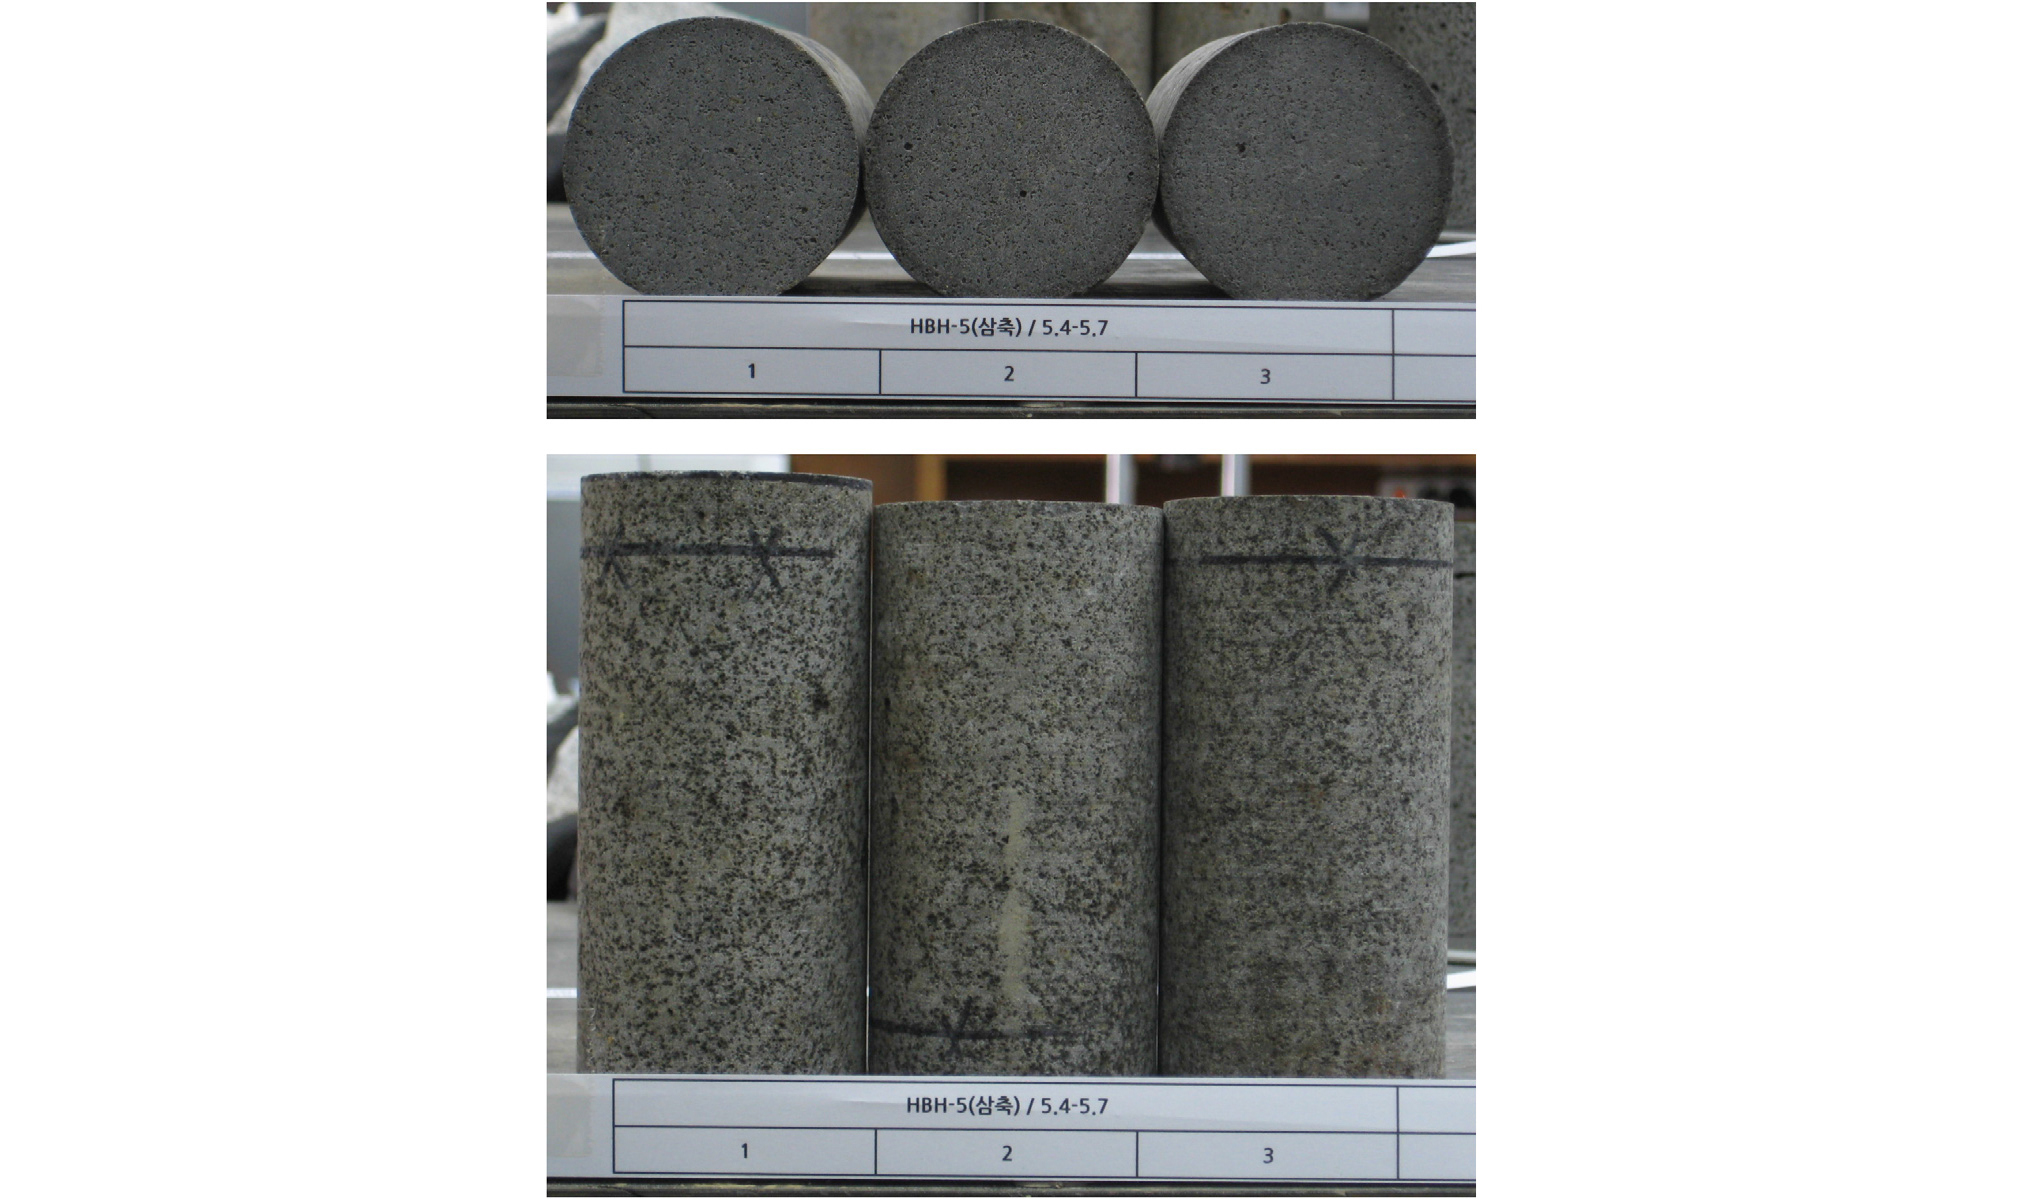
암석은 NX구경인 코어 시추기를 이용하여 채취하였으며, 한국암반공학회 시험편 제작 표준법(2005)에서 제시하고 있는 종횡비(h/d; h: 암석 시편의 높이, d: 암석 시편의 직경)에 만족하도록 Fig. 4와 같이 원주형 암석 시편을 제작하였고(제주도 북동부: h=99.78±2.67mm, d= 50.36±0.26mm; 제주도 남동부: h=121.56±1.05mm, d= 52.52±0.55mm; 제주도 북서부: h=110.78±5.20mm, d= 49.94±0.24mm), 이들 현무암 암석 시편에 대하여 ASTM규정 D 7012에 따라 5MPa, 10MPa, 15MPa인 구속압력 아래에서 가압속도를 0.5MPa/s로 축하중을 가하여 삼축압축시험(압축시험기: KDC9409-20; 삼축압축셀: NX코어용)을 수행하였다. 한편 본 연구에서 이들 삼축압축시험 결과와 비교하는 Kim(2006)과 Nam et al.(2009)의 연구에서는, 직경이 43mm, 높이가 86mm인 표선리 현무암, 조면암질 현무암 암석 시료에 대하여 5MPa, 10MPa, 15MPa, 20MPa인 구속압력 하에서 그리고 스코리아 암석 시료(d=43mm, h=86mm)에 대해서는 5MPa, 10MPa, 20MPa인 구속압력 하에서 삼축압축시험이 각각 이루어졌다.

http://static.apub.kr/journalsite/sites/kgs/2016-032-03/N0990320302/images/figure_KGS_32_03_02_F3.jpg

Fig. 3. Location of the boring area

http://static.apub.kr/journalsite/sites/kgs/2016-032-03/N0990320302/images/figure_KGS_32_03_02_F4.jpg

Fig. 4. Some of test specimens

삼축압축시험에 대한 결과는 Table 4와 Table 5에 각각 정리하였다. Table 4에는 제주도 북동부 육해상, 남동부 해상 및 북서부 해상에서 채취한 현무암 암석에 대한 삼축압축시험 결과와 이 결과를 이용하여 Mohr-Coulomb 파괴기준의 파라미터인 점착력과 내부 마찰각을 계산하기 위한 식 (3)에 나타낸 선형 관계식 및 결정계수, 그리고 식 (4)와 (5)에 의해 계산된 내부 마찰각과 점착력을 각각 나타내었으며, Table 5에는 Kim(2006)과 Nam et al.(2009)의 연구 결과를 정리하였다.

Table 4. Summary of the results obtained from the triaxial compression tests for basalts sampled in northeastern, southeastern and northwestern Jeju Island

Borehole

No.

Depth

(m)

w

(%)

http://static.apub.kr/journalsite/sites/kgs/2016-032-03/N0990320302/images/PICAC94.gif

(MPa)

http://static.apub.kr/journalsite/sites/kgs/2016-032-03/N0990320302/images/PICACC4.gif

(MPa)

http://static.apub.kr/journalsite/sites/kgs/2016-032-03/N0990320302/images/PICAD03.gif

(R2)

http://static.apub.kr/journalsite/sites/kgs/2016-032-03/N0990320302/images/PICAD24.gif&http://static.apub.kr/journalsite/sites/kgs/2016-032-03/N0990320302/images/PICAD63.gif

(MPa)

http://static.apub.kr/journalsite/sites/kgs/2016-032-03/N0990320302/images/PICAD74.gif&http://static.apub.kr/journalsite/sites/kgs/2016-032-03/N0990320302/images/PICADA4.gif

(degree)

Southeast offshore

BH-1

4.6~5.0

1.315

5.0

283.1

http://static.apub.kr/journalsite/sites/kgs/2016-032-03/N0990320302/images/PICADC4.gif=244.3+7.97http://static.apub.kr/journalsite/sites/kgs/2016-032-03/N0990320302/images/PICADE4.gif

(0.998)

43.27

50.99

10.0

326.1

15.0

362.8

BH-3

3.6~4.0

3.594

5.0

90.2

http://static.apub.kr/journalsite/sites/kgs/2016-032-03/N0990320302/images/PICAE43.gif=68.033+4.44http://static.apub.kr/journalsite/sites/kgs/2016-032-03/N0990320302/images/PICAE73.gif

(1.000)

16.14

39.22

10.0

112.5

15.0

134.6

BH-5

9.3~9.7

3.437

5.0

152.6

http://static.apub.kr/journalsite/sites/kgs/2016-032-03/N0990320302/images/PICAEA3.gif=114.7+7.81http://static.apub.kr/journalsite/sites/kgs/2016-032-03/N0990320302/images/PICAEB3.gif

(0.997)

20.53

50.62

10.0

195.3

15.0

230.7

BH-7

9.0~9.4

5.847

5.0

109.5

http://static.apub.kr/journalsite/sites/kgs/2016-032-03/N0990320302/images/PICAED3.gif=79.933+6http://static.apub.kr/journalsite/sites/kgs/2016-032-03/N0990320302/images/PICAEF4.gif

(0.999)

16.32

45.58

10.0

140.8

15.0

169.5

BH-10

9.6~9.9

2.753

5.0

147.5

http://static.apub.kr/journalsite/sites/kgs/2016-032-03/N0990320302/images/PICAF14.gif=117.8+5.99http://static.apub.kr/journalsite/sites/kgs/2016-032-03/N0990320302/images/PICAF34.gif

(1.000)

24.07

45.55

10.0

178.2

15.0

207.4

Northwest offshore

HBH-1

4.7~5.0

4.316

5.0

106.7

http://static.apub.kr/journalsite/sites/kgs/2016-032-03/N0990320302/images/PICAF74.gif=73.5+6.69http://static.apub.kr/journalsite/sites/kgs/2016-032-03/N0990320302/images/PICAFA4.gif

(1.000)

14.21

47.72

10.0

140.9

15.0

173.6

HBH-3

8.4~8.8

4.662

5.0

100.2

http://static.apub.kr/journalsite/sites/kgs/2016-032-03/N0990320302/images/PICB002.gif=67.9+6.43http://static.apub.kr/journalsite/sites/kgs/2016-032-03/N0990320302/images/PICB023.gif

(1.000)

13.39

46.96

10.0

131.9

15.0

164.5

HBH-5

5.4~5.7

3.187

5.0

133.5

http://static.apub.kr/journalsite/sites/kgs/2016-032-03/N0990320302/images/PICB043.gif=94.9+7.71http://static.apub.kr/journalsite/sites/kgs/2016-032-03/N0990320302/images/PICB053.gif

(1.000)

17.09

50.39

10.0

171.9

15.0

210.6

w: Absorption, http://static.apub.kr/journalsite/sites/kgs/2016-032-03/N0990320302/images/PICB093.gif: Minimum effective stress, http://static.apub.kr/journalsite/sites/kgs/2016-032-03/N0990320302/images/PICB0C3.gif: Maximum effective stress

Table 5. Summary of the results obtained from the triaxial compression tests for Pyoseonri basalt, Trachy-basalt and Scoria (Kim, 2006; Nam et al., 2009)

w

(%)

http://static.apub.kr/journalsite/sites/kgs/2016-032-03/N0990320302/images/PICB0F3.gif

(MPa)

http://static.apub.kr/journalsite/sites/kgs/2016-032-03/N0990320302/images/PICB123.gif

(MPa)

http://static.apub.kr/journalsite/sites/kgs/2016-032-03/N0990320302/images/PICB143.gif

(R2)

http://static.apub.kr/journalsite/sites/kgs/2016-032-03/N0990320302/images/PICB163.gif&http://static.apub.kr/journalsite/sites/kgs/2016-032-03/N0990320302/images/PICB174.gif

(MPa)

http://static.apub.kr/journalsite/sites/kgs/2016-032-03/N0990320302/images/PICB194.gif&http://static.apub.kr/journalsite/sites/kgs/2016-032-03/N0990320302/images/PICB195.gif

(degree)

Pyoseonri basalt

2.973±0.347

0

25.06

http://static.apub.kr/journalsite/sites/kgs/2016-032-03/N0990320302/images/PICB1B5.gif=15.862+8.002http://static.apub.kr/journalsite/sites/kgs/2016-032-03/N0990320302/images/PICB1E5.gif

(0.975)

2.80

51.06

5

42.53

10

101.72

15

127.45

20

182.65

Trachy-basalt

0.866±0.057

0

127.96

http://static.apub.kr/journalsite/sites/kgs/2016-032-03/N0990320302/images/PICB225.gif=121.56+16.795http://static.apub.kr/journalsite/sites/kgs/2016-032-03/N0990320302/images/PICB245.gif

(0.96)

14.83

62.57

5

173.64

10

331.10

15

360.41

20

454.44

Scoria

8.284±0.681

0

13.37

http://static.apub.kr/journalsite/sites/kgs/2016-032-03/N0990320302/images/PICB2B3.gif=12.872+3.9403http://static.apub.kr/journalsite/sites/kgs/2016-032-03/N0990320302/images/PICB2D3.gif

(0.984)

3.24

36.52

5

28.14

10

57.93

20

89.96

4. 삼축압축시험 결과에 대한 분석 및 고찰

제주도 현무암 암석에 대한 Hoek-Brown 계수 http://static.apub.kr/journalsite/sites/kgs/2016-032-03/N0990320302/images/PICEC38.gif의 특성과 Hoek-Brown 파괴기준으로부터 추정된 점착력 및 내부 마찰각을 살펴보기 위한 일련의 과정 및 결과를 Table 6과 Table 7에 각각 정리하였다. Table 6에는 Table 4에 나타낸 제주도 북동부 육해상, 남동부 해상 및 북서부 해상에서 채취한 현무암 암석의 삼축압축시험 결과에 대한 식 (10)에 나타낸 선형 관계식 및 결정계수, 그리고 Hoek-Brown 파괴기준으로부터 추정된 점착력과 내부 마찰각을 나타내었다. 그리고 Table 7에는 Table 5에 나타낸 Kim(2006)과 Nam et al.(2009)의 삼축압축시험 결과에 대한 분석 결과를 정리하였다. 여기서, Table 6과 Table 7에 나타낸 식 (10)의 선형관계식 및 결정계수는 Hoek and Brown의 연구와 일관성을 유지하기 위하여 Hoek and Brown(1997)에서 언급된 바와 같이 삼축압축시험 결과에서 http://static.apub.kr/journalsite/sites/kgs/2016-032-03/N0990320302/images/PICECD5.gif인 범위에 포함된 결과에 대한 값을 나타내었으며, Hoek-Brown 파괴기준으로부터의 점착력 및 내부 마찰각의 추정은 Hoek and Brown(1997)에서 제시된 바와 같이 식 (6)에 나타낸 관계식을 이용하여 http://static.apub.kr/journalsite/sites/kgs/2016-032-03/N0990320302/images/PICED34.gif인 범위에 있는 8개의 같은 간격으로 떨어진 http://static.apub.kr/journalsite/sites/kgs/2016-032-03/N0990320302/images/PICED45.gif 값들에 대한 http://static.apub.kr/journalsite/sites/kgs/2016-032-03/N0990320302/images/PICED65.gif 값을 각각 구하고, (http://static.apub.kr/journalsite/sites/kgs/2016-032-03/N0990320302/images/PICED85.gif, http://static.apub.kr/journalsite/sites/kgs/2016-032-03/N0990320302/images/PICED96.gif) 값들에 대한 선형회귀분석을 통하여 식 (3)과 같은 선형 관계식을 구하였으며, 식 (4)와 (5)를 이용하여 내부 마찰각과 점착력을 각각 계산하였다.

Table 6. Summary of the results analyzed by Hoek-Brown failure criterion from the results of triaxial compression tests indicated in Table 4

Borehole

No.

Depth

(m)

http://static.apub.kr/journalsite/sites/kgs/2016-032-03/N0990320302/images/PICB313.gif

(R2)

http://static.apub.kr/journalsite/sites/kgs/2016-032-03/N0990320302/images/PICB352.gif

(R2)

http://static.apub.kr/journalsite/sites/kgs/2016-032-03/N0990320302/images/PICB392.gif&http://static.apub.kr/journalsite/sites/kgs/2016-032-03/N0990320302/images/PICB3A3.gif

(MPa)

http://static.apub.kr/journalsite/sites/kgs/2016-032-03/N0990320302/images/PICB3E2.gif&http://static.apub.kr/journalsite/sites/kgs/2016-032-03/N0990320302/images/PICB402.gif

(degree)

Northeast

(JB: onshore,

BH: offshore)

JB-1

4.0~4.5

http://static.apub.kr/journalsite/sites/kgs/2016-032-03/N0990320302/images/PICB413.gif=37.598http://static.apub.kr/journalsite/sites/kgs/2016-032-03/N0990320302/images/PICB424.gif+1

(0.949)

http://static.apub.kr/journalsite/sites/kgs/2016-032-03/N0990320302/images/PICB453.gif=40.737+9.6075http://static.apub.kr/journalsite/sites/kgs/2016-032-03/N0990320302/images/PICB474.gif

(0.981)

6.57

54.24

BH-1

12.2~12.6

http://static.apub.kr/journalsite/sites/kgs/2016-032-03/N0990320302/images/PICB484.gif=38.815http://static.apub.kr/journalsite/sites/kgs/2016-032-03/N0990320302/images/PICB485.gif+1

(0.979)

http://static.apub.kr/journalsite/sites/kgs/2016-032-03/N0990320302/images/PICB4A6.gif=119.1+9.783http://static.apub.kr/journalsite/sites/kgs/2016-032-03/N0990320302/images/PICB4B6.gif

(0.981)

19.04

54.54

BH-8

9.1~9.5

http://static.apub.kr/journalsite/sites/kgs/2016-032-03/N0990320302/images/PICB4C7.gif=39.297http://static.apub.kr/journalsite/sites/kgs/2016-032-03/N0990320302/images/PICB4D7.gif+1

(0.949)

http://static.apub.kr/journalsite/sites/kgs/2016-032-03/N0990320302/images/PICB4E8.gif=52.046+9.8518http://static.apub.kr/journalsite/sites/kgs/2016-032-03/N0990320302/images/PICB508.gif

(0.981)

8.29

54.66

BH-8

13.7~14.6

http://static.apub.kr/journalsite/sites/kgs/2016-032-03/N0990320302/images/PICB529.gif=34.882http://static.apub.kr/journalsite/sites/kgs/2016-032-03/N0990320302/images/PICB539.gif+1

(1.000)

http://static.apub.kr/journalsite/sites/kgs/2016-032-03/N0990320302/images/PICB54A.gif=16.209+9.2056http://static.apub.kr/journalsite/sites/kgs/2016-032-03/N0990320302/images/PICB56A.gif

(0.982)

2.67

53.52

BH-9

9.5~10.0

http://static.apub.kr/journalsite/sites/kgs/2016-032-03/N0990320302/images/PICB59A.gif=32.251http://static.apub.kr/journalsite/sites/kgs/2016-032-03/N0990320302/images/PICB59B.gif+1

(0.980)

http://static.apub.kr/journalsite/sites/kgs/2016-032-03/N0990320302/images/PICB5CB.gif=36.775+8.8019http://static.apub.kr/journalsite/sites/kgs/2016-032-03/N0990320302/images/PICB5EB.gif

(0.984)

6.2

52.75

Southeast 

offshore

BH-1

4.6~5.0

http://static.apub.kr/journalsite/sites/kgs/2016-032-03/N0990320302/images/PICB60B.gif=16.489http://static.apub.kr/journalsite/sites/kgs/2016-032-03/N0990320302/images/PICB61C.gif+1

(0.997)

http://static.apub.kr/journalsite/sites/kgs/2016-032-03/N0990320302/images/PICB63C.gif=264.09+5.9618http://static.apub.kr/journalsite/sites/kgs/2016-032-03/N0990320302/images/PICB65C.gif

(0.991)

54.08

45.46

BH-3

3.6~4.0

http://static.apub.kr/journalsite/sites/kgs/2016-032-03/N0990320302/images/PICB66D.gif=9.116http://static.apub.kr/journalsite/sites/kgs/2016-032-03/N0990320302/images/PICB67E.gif+1

(0.991)

http://static.apub.kr/journalsite/sites/kgs/2016-032-03/N0990320302/images/PICB6AE.gif=70.58+4.2105http://static.apub.kr/journalsite/sites/kgs/2016-032-03/N0990320302/images/PICB6CE.gif

(0.996)

17.2

38.04

BH-5

9.3~9.7

http://static.apub.kr/journalsite/sites/kgs/2016-032-03/N0990320302/images/PICB6EE.gif=18.796http://static.apub.kr/journalsite/sites/kgs/2016-032-03/N0990320302/images/PICB6FF.gif+1

(0.991)

http://static.apub.kr/journalsite/sites/kgs/2016-032-03/N0990320302/images/PICB70F.gif=125.65+6.4373http://static.apub.kr/journalsite/sites/kgs/2016-032-03/N0990320302/images/PICB730.gif

(0.990)

24.76

46.98

BH-7

9.0~9.4

http://static.apub.kr/journalsite/sites/kgs/2016-032-03/N0990320302/images/PICB77F.gif=14.014http://static.apub.kr/journalsite/sites/kgs/2016-032-03/N0990320302/images/PICB7ED.gif+1

(0.989)

http://static.apub.kr/journalsite/sites/kgs/2016-032-03/N0990320302/images/PICB7FE.gif=85.224+5.4186http://static.apub.kr/journalsite/sites/kgs/2016-032-03/N0990320302/images/PICB82E.gif

(0.993)

18.31

43.50

BH-10

9.6~9.9

http://static.apub.kr/journalsite/sites/kgs/2016-032-03/N0990320302/images/PICB84E.gif=12.695http://static.apub.kr/journalsite/sites/kgs/2016-032-03/N0990320302/images/PICB86E.gif+1

(0.994)

http://static.apub.kr/journalsite/sites/kgs/2016-032-03/N0990320302/images/PICB88E.gif=124.67+5.1127http://static.apub.kr/journalsite/sites/kgs/2016-032-03/N0990320302/images/PICB8BE.gif

(0.994)

27.57

42.28

Northwest 

offshore

HBH-1

4.7~5.0

http://static.apub.kr/journalsite/sites/kgs/2016-032-03/N0990320302/images/PICB8DE.gif=17.038http://static.apub.kr/journalsite/sites/kgs/2016-032-03/N0990320302/images/PICB90E.gif+1

(0.985)

http://static.apub.kr/journalsite/sites/kgs/2016-032-03/N0990320302/images/PICB92F.gif=79.696+6.0775http://static.apub.kr/journalsite/sites/kgs/2016-032-03/N0990320302/images/PICB94F.gif

(0.991)

16.16

45.84

HBH-3

8.4~8.8

http://static.apub.kr/journalsite/sites/kgs/2016-032-03/N0990320302/images/PICB95F.gif=16.447http://static.apub.kr/journalsite/sites/kgs/2016-032-03/N0990320302/images/PICB970.gif+1

(0.982)

http://static.apub.kr/journalsite/sites/kgs/2016-032-03/N0990320302/images/PICB9A0.gif=73.383+5.9529http://static.apub.kr/journalsite/sites/kgs/2016-032-03/N0990320302/images/PICB9C0.gif

(0.991)

15.04

45.43

HBH-5

5.4~5.7

http://static.apub.kr/journalsite/sites/kgs/2016-032-03/N0990320302/images/PICB9E0.gif=19.521http://static.apub.kr/journalsite/sites/kgs/2016-032-03/N0990320302/images/PICBA01.gif+1

(0.986)

http://static.apub.kr/journalsite/sites/kgs/2016-032-03/N0990320302/images/PICBA40.gif=104.31+6.5813http://static.apub.kr/journalsite/sites/kgs/2016-032-03/N0990320302/images/PICBA60.gif

(0.990)

20.33

47.41

http://static.apub.kr/journalsite/sites/kgs/2016-032-03/N0990320302/images/PICBA90.gif, http://static.apub.kr/journalsite/sites/kgs/2016-032-03/N0990320302/images/PICBAB1.gif, http://static.apub.kr/journalsite/sites/kgs/2016-032-03/N0990320302/images/PICBAC1.gif: Results in a range of http://static.apub.kr/journalsite/sites/kgs/2016-032-03/N0990320302/images/PICBB01.gif

http://static.apub.kr/journalsite/sites/kgs/2016-032-03/N0990320302/images/PICBB11.gif: Uniaxial compressive strength (indicated in Table 4) estimated by Mohr-Coulomb failure criterion in terms of principal stresses was used in analyzing http://static.apub.kr/journalsite/sites/kgs/2016-032-03/N0990320302/images/PICBB22.gif.

Table 7. Summary of the results analyzed by Hoek-Brown failure criterion from the results of triaxial compression tests indicated in Table 5

http://static.apub.kr/journalsite/sites/kgs/2016-032-03/N0990320302/images/PICBB42.gif

(R2)

http://static.apub.kr/journalsite/sites/kgs/2016-032-03/N0990320302/images/PICBB82.gif

(R2)

http://static.apub.kr/journalsite/sites/kgs/2016-032-03/N0990320302/images/PICBBB2.gif&http://static.apub.kr/journalsite/sites/kgs/2016-032-03/N0990320302/images/PICBBD2.gif

(MPa)

http://static.apub.kr/journalsite/sites/kgs/2016-032-03/N0990320302/images/PICBBF2.gif&http://static.apub.kr/journalsite/sites/kgs/2016-032-03/N0990320302/images/PICBC12.gif

(degree)

Pyoseonri basalt

http://static.apub.kr/journalsite/sites/kgs/2016-032-03/N0990320302/images/PICBC23.gif=26.097http://static.apub.kr/journalsite/sites/kgs/2016-032-03/N0990320302/images/PICBC24.gif+1

(0.789)

http://static.apub.kr/journalsite/sites/kgs/2016-032-03/N0990320302/images/PICBC35.gif=28.515+7.7918http://static.apub.kr/journalsite/sites/kgs/2016-032-03/N0990320302/images/PICBC55.gif

(0.986)

5.11

50.58

Trachy-basalt

http://static.apub.kr/journalsite/sites/kgs/2016-032-03/N0990320302/images/PICBC65.gif=61.675http://static.apub.kr/journalsite/sites/kgs/2016-032-03/N0990320302/images/PICBC76.gif+1

(0.937)

http://static.apub.kr/journalsite/sites/kgs/2016-032-03/N0990320302/images/PICBC87.gif=169.63+12.688http://static.apub.kr/journalsite/sites/kgs/2016-032-03/N0990320302/images/PICBCA7.gif

(0.974)

23.81

58.64

Scoria

http://static.apub.kr/journalsite/sites/kgs/2016-032-03/N0990320302/images/PICBCB8.gif=5.3359http://static.apub.kr/journalsite/sites/kgs/2016-032-03/N0990320302/images/PICBCC8.gif+1

(1.000)

http://static.apub.kr/journalsite/sites/kgs/2016-032-03/N0990320302/images/PICBCD9.gif=13.599+3.0997http://static.apub.kr/journalsite/sites/kgs/2016-032-03/N0990320302/images/PICBCF9.gif

(0.998)

3.86

30.81

http://static.apub.kr/journalsite/sites/kgs/2016-032-03/N0990320302/images/PICBD58.gif, http://static.apub.kr/journalsite/sites/kgs/2016-032-03/N0990320302/images/PICBD78.gif, http://static.apub.kr/journalsite/sites/kgs/2016-032-03/N0990320302/images/PICBD98.gif: Results in a range of http://static.apub.kr/journalsite/sites/kgs/2016-032-03/N0990320302/images/PICBDD8.gif

http://static.apub.kr/journalsite/sites/kgs/2016-032-03/N0990320302/images/figure_KGS_32_03_02_F5.jpg

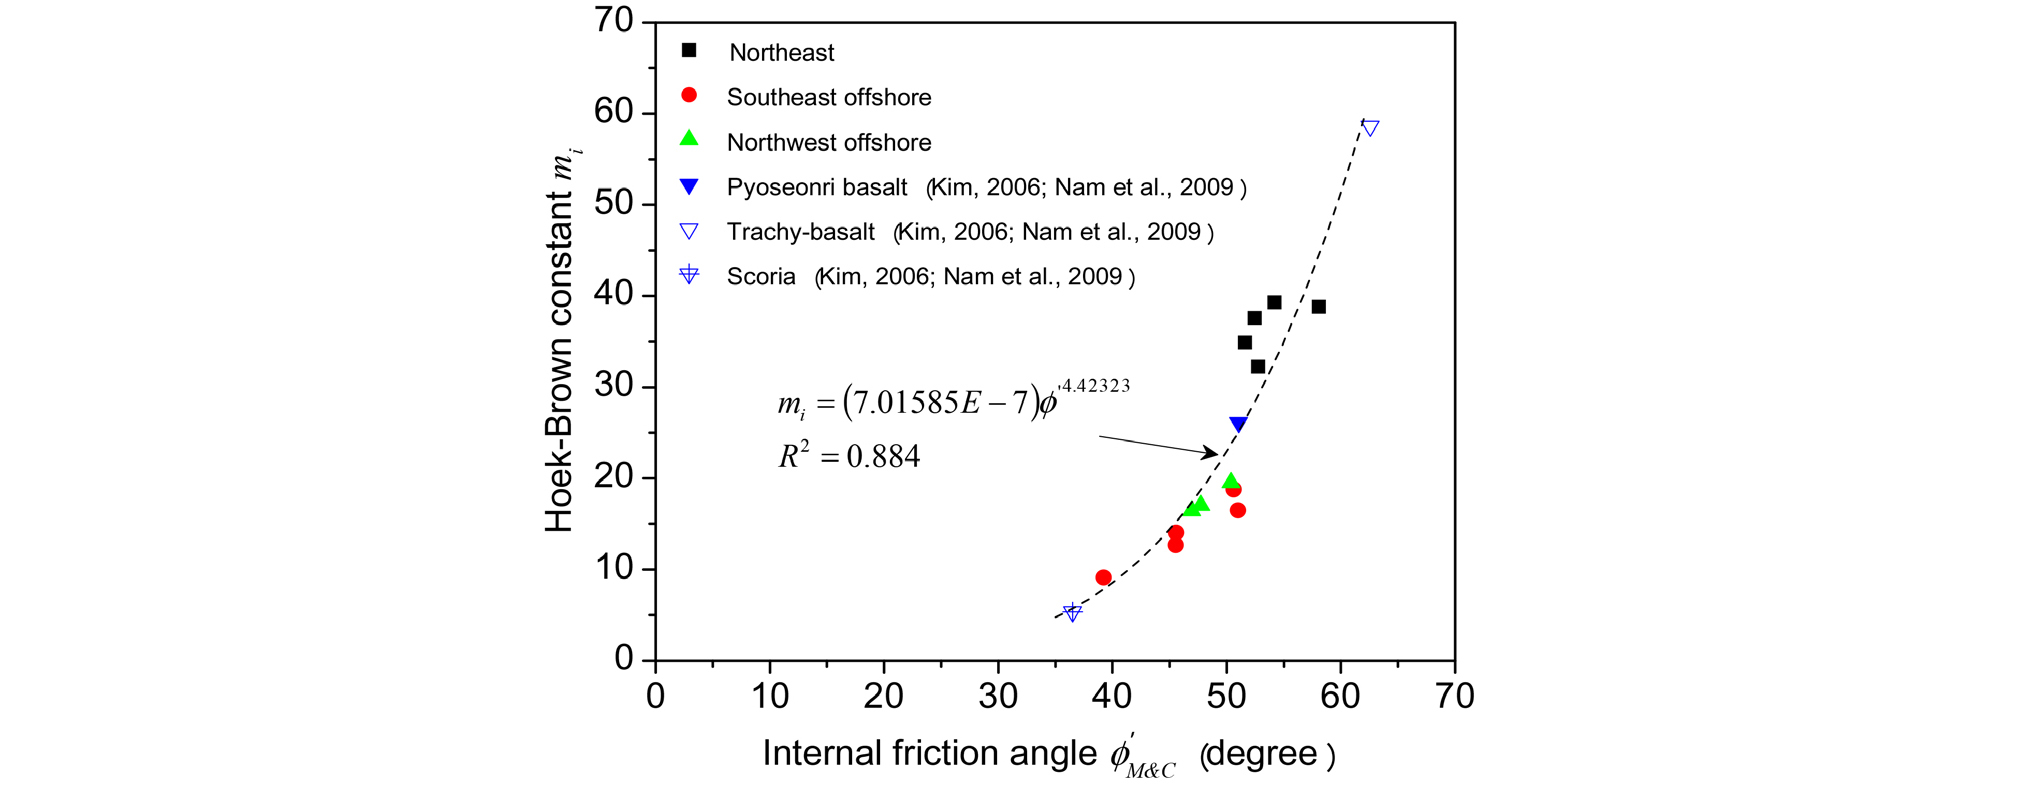
Fig. 5. Relationship between Hoek-Brown constant and internal friction angle

제주도 현무암 암석에 대한 Hoek-Brown 계수 http://static.apub.kr/journalsite/sites/kgs/2016-032-03/N0990320302/images/PICEDB6.gif의 특성을 살펴보기 위하여, Table 6과 7에 나타낸 각각의 현무암 암석에 대한 Hoek-Brown 계수 http://static.apub.kr/journalsite/sites/kgs/2016-032-03/N0990320302/images/PICEDB7.gif와 Table 4와 5에 나타낸 Mohr-Coulomb 파괴기준의 내부 마찰각과의 관계를 Fig. 5에 나타내었다. Fig. 5를 통하여 Marinos and Hoek(2000)에서 Hoek-Brown 계수 http://static.apub.kr/journalsite/sites/kgs/2016-032-03/N0990320302/images/PICEDD7.gif는 암석의 마찰 특성과 연관되어 있다고 간략하게 언급되어 있듯이, 암석의 내부 마찰각과 Hoek-Brown 계수 http://static.apub.kr/journalsite/sites/kgs/2016-032-03/N0990320302/images/PICEDE8.gif 사이에는 밀접한 관계가 있음을 알 수 있다. 그리고 내부 마찰각이 증가함에 따라 Hoek-Brown 계수 http://static.apub.kr/journalsite/sites/kgs/2016-032-03/N0990320302/images/PICEDF9.gif는 약 5에서 60까지 급격하게 증가하고 있으며, Table 2에 나타내고 있는 현무암 암석에 대한 Hoek-Brown 계수 http://static.apub.kr/journalsite/sites/kgs/2016-032-03/N0990320302/images/PICEE09.gif의 범위보다 훨씬 넓은 범위에 걸쳐 Hoek-Brown 계수 http://static.apub.kr/journalsite/sites/kgs/2016-032-03/N0990320302/images/PICEE1A.gif의 특성값이 존재하고 있음을 알 수 있다.

http://static.apub.kr/journalsite/sites/kgs/2016-032-03/N0990320302/images/figure_KGS_32_03_02_F6.jpg

Fig. 6. Relationship between internal friction angle and absorption (Yang, 2015b)

http://static.apub.kr/journalsite/sites/kgs/2016-032-03/N0990320302/images/figure_KGS_32_03_02_F7.jpg

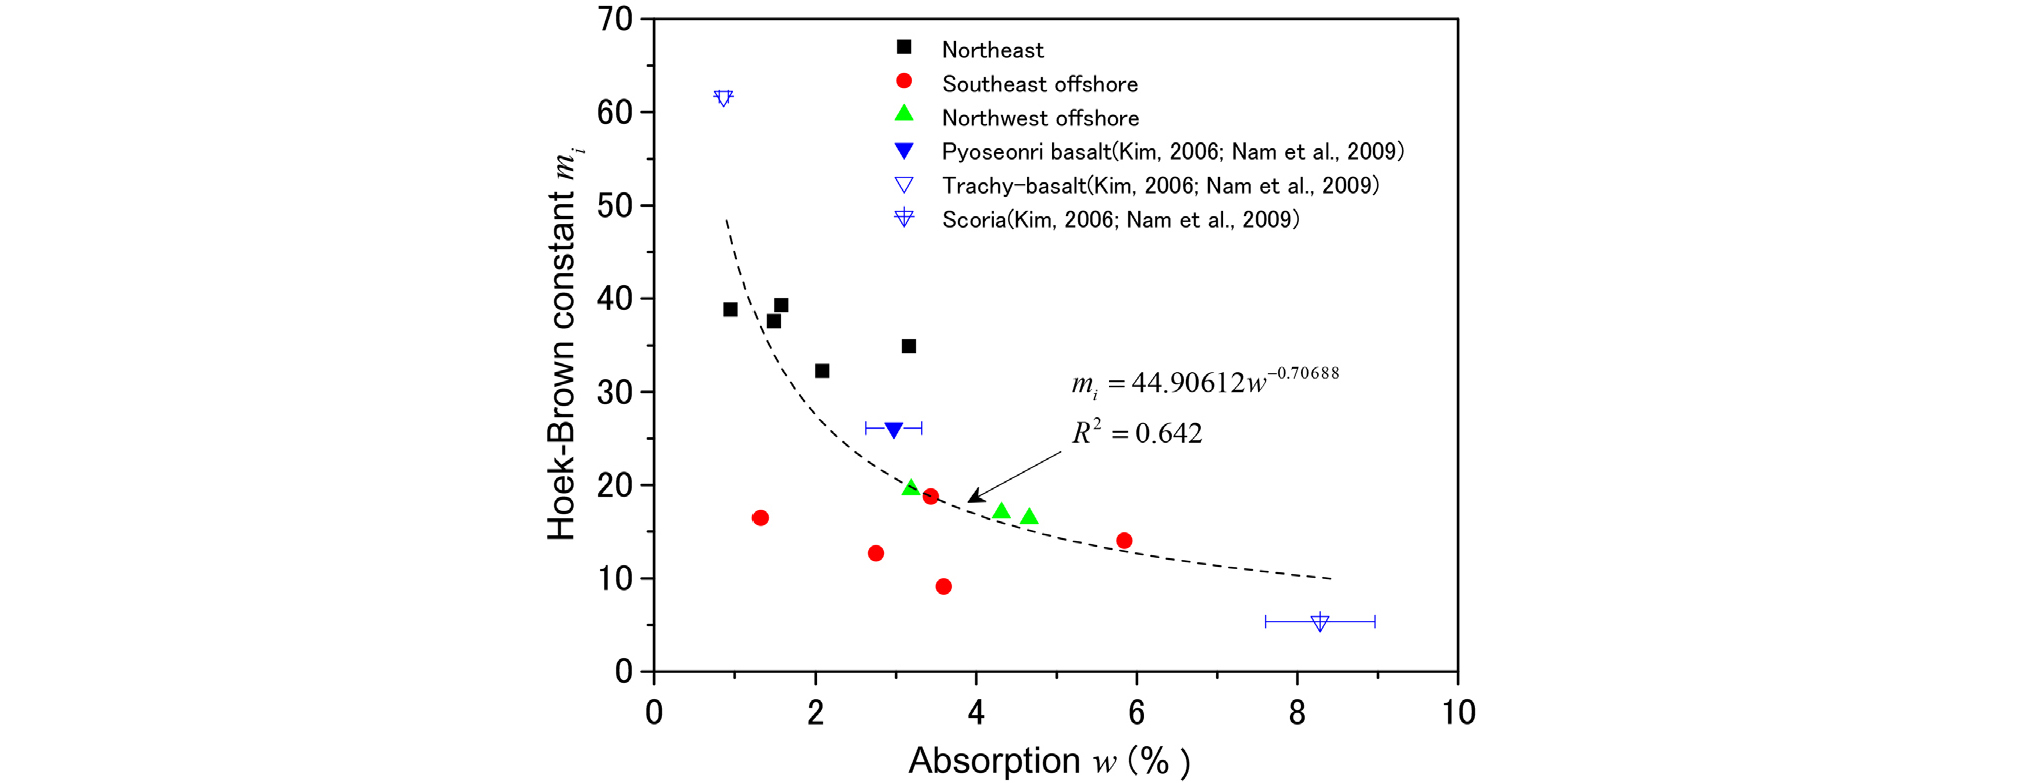
Fig. 7. Relationship between Hoek-Brown constant and absorption

한편, Yang(2015b)은 Fig. 6과 같이 제주도 현무암 암석에 대한 흡수율과 내부 마찰각의 관계를 나타내어, 제주도 현무암의 내부 마찰각은 현무암 암석의 공극 특성에 크게 영향을 받고 있다고 언급하고 있으며, 제주도 현무암 암석에 대한 흡수율과 Hoek-Brown 계수 http://static.apub.kr/journalsite/sites/kgs/2016-032-03/N0990320302/images/PICEE2B.gif의 관계를 살펴보기 위하여 Fig. 7에 그 관계를 나타내었다. Fig. 7을 통하여 알 수 있듯이, 제주도 현무암 암석에 대한 흡수율과 Hoek-Brown 계수 http://static.apub.kr/journalsite/sites/kgs/2016-032-03/N0990320302/images/PICEE3B.gif 사이의 연관성을 어느 정도 알 수 있으나, 흡수율을 통하여 직접적으로 Hoek-Brown 계수 http://static.apub.kr/journalsite/sites/kgs/2016-032-03/N0990320302/images/PICEE4C.gif를 추정하기에는 약간 부족하다고 느껴진다. 따라서 제주도 현무암에 대한 Hoek-Brown 계수 http://static.apub.kr/journalsite/sites/kgs/2016-032-03/N0990320302/images/PICEE4D.gif를 추정하기 위해서는 Fig. 6을 이용하여 흡수율로부터 내부 마찰각을 산정한 후, Fig. 5를 이용하여 Hoek-Brown 계수 http://static.apub.kr/journalsite/sites/kgs/2016-032-03/N0990320302/images/PICEE5D.gif를 추정하는 것이 좀 더 바람직하다고 사료되며, 이 결과로부터 현무암 암석에 대한 물성시험을 통하여 초기설계를 수행하는데 있어서 필요로 되는 현무암 암석, 또는 적절한 GSI값을 이용하여 현무암 암반에 대한 강도정수를 대략적으로 추정할 수 있을 것이라 생각한다.
http://static.apub.kr/journalsite/sites/kgs/2016-032-03/N0990320302/images/figure_KGS_32_03_02_F8.jpg

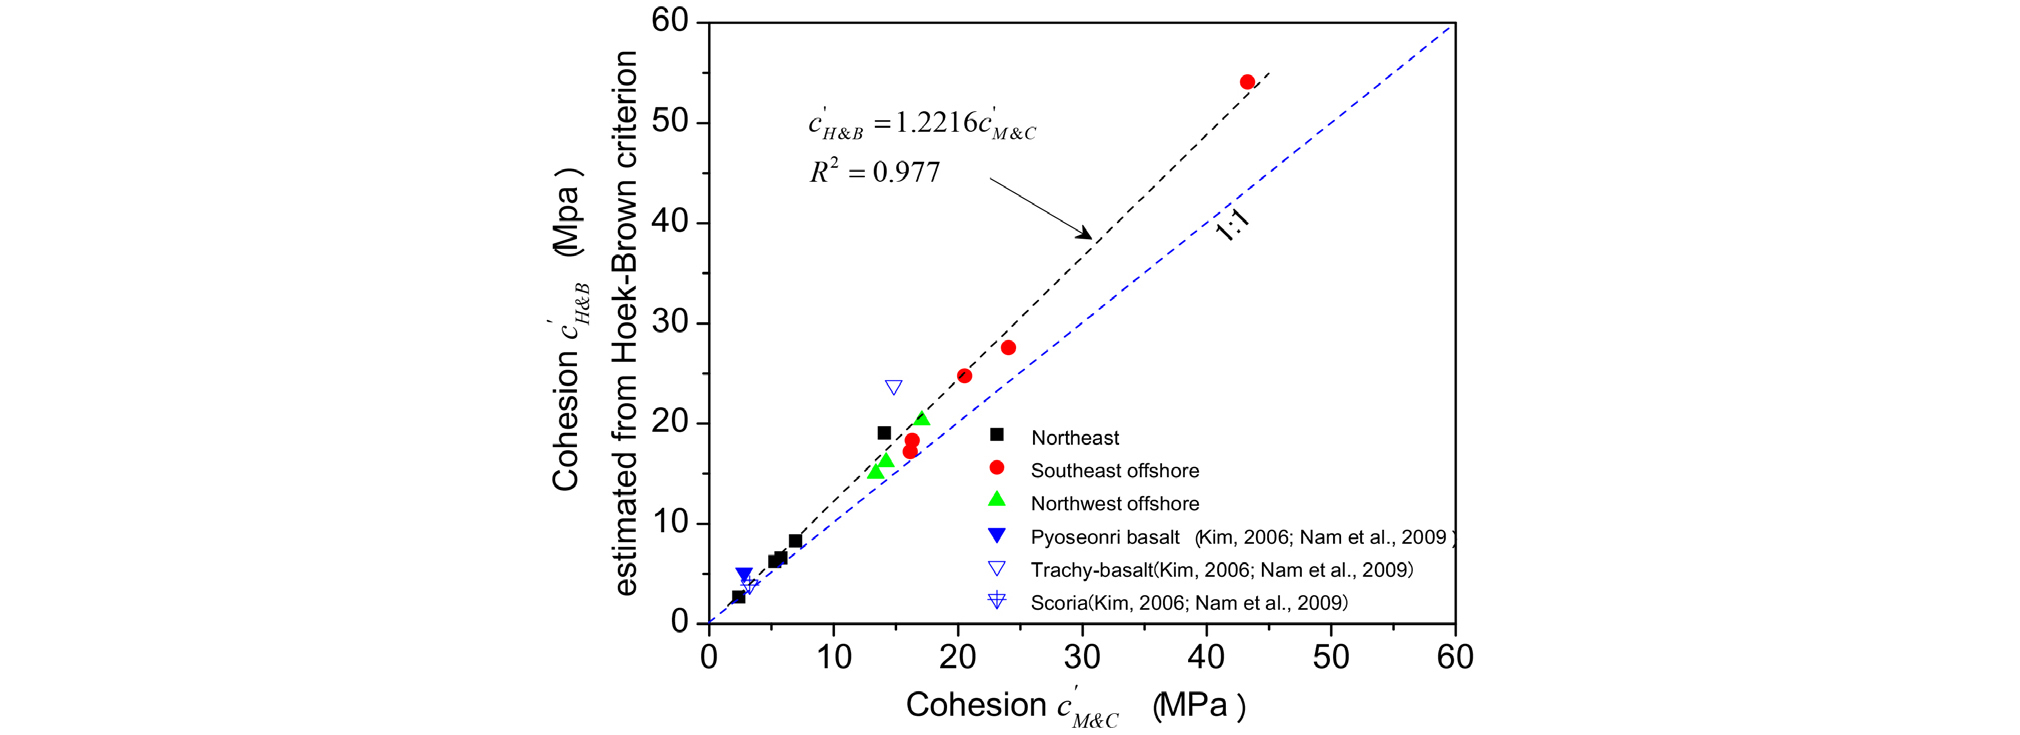
Fig. 8. Comparison between cohesions estimated from Hoek-Brown criterion and those of Mohr-Coulomb criterion

http://static.apub.kr/journalsite/sites/kgs/2016-032-03/N0990320302/images/figure_KGS_32_03_02_F9.jpg

Fig. 9. Comparison between internal friction angles estimated from Hoek-Brown criterion and those of Mohr-Coulomb criterion

제주도 현무암 암석에 대한 삼축압축시험 결과로부터 산정된 Mohr-Coulomb 파괴기준의 파라미터인 점착력 및 내부 마찰각, 그리고 Hoek-Brown 파괴기준으로부터 추정된 점착력과 내부 마찰각을 비교하기 위하여 Fig. 8과 9에 그 결과를 각각 도시하였다. Fig. 8에서는 Mohr-Coulomb 파괴기준의 점착력과 Hoek-Brown 파괴기준으로부터 추정된 점착력을 비교하였으며, Fig. 9에서는 Mohr-Coulomb 파괴기준의 내부 마찰각과 Hoek- Brown 파괴기준으로부터 추정된 내부 마찰각을 비교하였다.

Fig. 8에 나타낸 결과를 통하여 알 수 있듯이, Hoek- Brown 파괴기준으로부터 추정된 점착력은 Mohr-Coulomb 파괴기준으로부터 산정된 점착력보다 전체적으로 과대하게 추정되고 있음을 알 수 있다. Hoek and Brown(1997)에서도 Hoek-Brown 파괴기준으로부터 추정된 점착력은 약 25% 정도 과대하게 추정되고 있다고 언급하고 있듯이, 본 연구의 결과 또한 평균적으로 약 24% 정도 과대하게 추정되고 있으며, 이 결과로부터 Hoek and Brown (1997)의 분석결과와 일치하고 있다고 생각한다. 그리고 Hoek and Brown(1997)에서는 Hoek-Brown 파괴기준으로부터 추정된 점착력을 초기설계에 이용할 시에는 약 25% 정도 줄여서 사용할 것을 권고하고 있듯이, 본 연구결과를 초기설계에 이용할 시에는 Hoek-Brown 파괴기준으로부터 추정된 점착력을 약 24% 정도 일률적으로 줄이거나, Fig. 8에 나타낸 선형 회귀관계식을 이용하여 점착력의 특성값을 재조정하는 것이 바람직하다고 사료된다.

Fig. 9의 결과를 통하여, Hoek-Brown 파괴기준으로부터 추정된 내부 마찰각은 Mohr-Coulomb 파괴기준으로부터 산정된 내부 마찰각과 비슷하거나 약간 작게 나타나고 있으며, 평균적으로 약 4% 정도 작게 평가되고 있다. 한편, Hoek and Brown(1997)에 의하면, Hoek-Brown 파괴기준으로부터 추정된 내부 마찰각은 Mohr-Coulomb 파괴기준의 내부 마찰각과 엇비슷한 결과를 나타내고 있다. 이러한 결과로부터 Hoek-Brown 파괴기준으로부터 추정된 내부 마찰각을 초기설계에 이용할 시에는 값의 재조정 없이 그대로 사용해도 무방하다고 사료된다.

그리고 Hoek and Brown(1997)에도 언급되어 있듯이, 암반 사면과 관련된 안정성 문제의 경우, 연직 유효응력이 매우 작을 수 있으며, Hoek-Brown 파괴기준에 의해 추정된 점착력과 내부 마찰각은 과대 평가될 수 있기 때문에, 점착력과 내부 마찰각의 특성값의 선정에 있어서 신중하여야 한다.

5. 결 론

본 연구에서는 제주도 북동부 육해상, 남동부 해상 및 북서부 해상에서 채취한 현무암 암석에 대한 삼축압축시험 결과를 이용하여, 제주도 현무암 암석에 대한 Hoek- Brown 파괴기준에서 사용되는 암석 계수 http://static.apub.kr/journalsite/sites/kgs/2016-032-03/N0990320302/images/PICEE7E.gif의 특성에 대해서 살펴보았으며, Hoek-Brown 파괴기준으로부터 추정된 점착력 및 내부 마찰각과 Mohr-Coulomb 파괴기준으로부터 산정된 점착력 및 내부 마찰각을 각각 비교・분석하였다. 얻어진 결과를 종합하면 다음과 같다.

(1)제주도 현무암 암석에 대한 Hoek-Brown 파괴기준의 암석 계수 http://static.apub.kr/journalsite/sites/kgs/2016-032-03/N0990320302/images/PICEE8E.gif는 암석의 내부 마찰각과 밀접하게 연관되어 있으며, 내부 마찰각이 증가함에 따라 급격하게 증가하는 경향이 있다. 그리고 현무암 암석의 공극 특성을 나타내는 흡수율과도 연관성을 나타내고 있다.

(2)현무암 암석에 대한 Hoek-Brown 계수 http://static.apub.kr/journalsite/sites/kgs/2016-032-03/N0990320302/images/PICEE8F.gif의 특성값은 Hoek and Brown(1997) 및 Marinos and Hoek(2000, 2001)에서 제시된 값의 범위보다 훨씬 넓은 범위에 걸쳐 그 특성값이 존재하고 있다.

(3)제주도 현무암 암석에 대하여 Hoek-Brown 파괴기준으로부터 추정된 점착력은 Mohr-Coulomb 파괴기준으로부터 산정된 점착력보다 과대하게 추정되고 있으며, Hoek-Brown 파괴기준으로부터 추정된 점착력을 초기설계에 사용할 시에는 점착력의 특성값을 재조정하는 것이 바람직하다고 사료된다.

(4)Hoek-Brown 파괴기준으로부터 추정된 내부 마찰각의 경우, Mohr-Coulomb 파괴기준으로부터 산정된 내부 마찰각과 비슷하거나 약간 작은 값을 나타내며, Hoek-Brown 파괴기준으로부터 추정된 내부 마찰각을 초기설계에 이용할 시에는 재조정 없이 그대로 사용해도 무방하다고 사료된다.

(5)본 연구에서 나타낸 그래프 및 회귀관계식은 제주도 현무암 암반에 대한 초기설계에 있어서 유용하게 이용될 수 있을 것이라 생각되며, 앞으로 흡수율이 8% 이상인 다공성 현무암 및 다양한 화산암에 대한 추가적인 연구가 필요하다고 사료된다.


References

1
1.ASTM D 7012-13, Standard Test Method for Compressive Strength and Elastic Moduli of Intact Rock Core Specimens under Varying States of Stress and Temperatures, ASTM International.
2
2.Brown, E.T. (Ed). (1981), Rock Characterization, Testing and Monitoring - ISRM Suggested Methods, Pergamon, pp.171-183.
3
3.Cho, T.C., Lee, S.B., Hwang, T.J., and Won, K.S. (2009), “Variations of Mechanical Properties of Hallasan Trachyte with Respect to the Degree of Weathering”, Tunnel and Underground Space, Vol.19, No.4, pp.287-303.
4
4.Eum, K.Y. (2002), Study on the Mechanical Properties of Volcanic Rocks in Chejudo, Master thesis, Yonsei University, p.63.
5
5.Hoek, E. and Brown, E.T. (1980), “Empirical Strength Criterion for Rock Masses”, Journal of the Geotechnical Engineering Division, ASCE, Vol.106, No.GT9, pp.1013-1035.
6
6.Hoek, E., Kaiser, P.K., and Bawden, W.F. (1995), Support of Underground Excavations in Hard Rock, Balkema, pp.91-106.
7
7.Hoek, E. and Brown, E.T. (1997), “Practical Estimates of Rock Mass Strength”, International Journal of Rock Mechanics and Mining Sciences, Vol.34, No.8, pp.1165-1186.
8
8.Hoek, E., Carranza-Torres, C., and Corkum, B. (2002), “Hoek-Brown Failure Criterion - 2002 Edition”, NARMS-TAC 2002: Mining and Tunneling Innovation and Opportunity, Vol.1, pp.267-273.
9
9.International Society for Rock Mechanics (1981), Suggested Methods for Rock Characterization, Testing and Monitoring, Pergamon Press.
10
10.Kim, J.H. (2006), A Study on the Mechanical Characteristics and the Strength in Pyoseonri Basalt, Master thesis, Cheju National University, p.93.
11
11.Kim, Y.K. and Choi, O.G. (1991), “Engineering Geological Charac-teristics of Volcanic Rocks of the Northwestern Cheju Island, Korea”, The Journal of Engineering Geology, Vol.1, No.1, pp.19-37.
12
12.Korean Geotechnical Society (2012), Geology and Rock Mechanics for Geotechnical Engineer II, CIR Publishing Company, pp.105-110.
13
13.Korean Society for Rock Mechanics (2005), Standard method for sampling and preparation of rock specimen, pp.81-84.
14
14.Marinos, P. and Hoek, E. (2000), “GSI: A Geologically Friendly Tool for Rock Mass Strength Estimation”, Proceedings of the International Conference on Geotechnical and Geological Engineering, pp.1422-1440.
15
15.Marinos, P. and Hoek, E. (2001), “Estimating the Geotechnical Properties of Heterogeneous Rock Masses such as Flysch”, Bulletin of Engineering Geology and the Environment, Vol.60, No.2, pp. 85-92.
16
16.Moon, K., Park, S., Kim, Y., and Yang, S. (2014), “Mechanical Properties of Basalt in Jeju Island with Respect to Porosity”, Journal of the Korean Society of Civil Engineering, Vol.34, No.4, pp.1215-1225.
17
17.Nam, J.M., Yun, J.M., Song, Y.S., and Kim, J.H. (2008a), “Analysis of Engineering Properties to Basalt in Cheju Island”, Journal of Korean Geosynthetics Society, Vol.7, No.1, pp.12-21.
18
18.Nam, J.M., Yun, J.M., Song, Y.S., and Kim, J.H. (2008b), “Analysis of Influence Factors to Compressive and Tensile Strength of Basalt in Cheju Island”, The Journal of Engineering Geology, Vol.18, No.2, pp.215-225.
19
19.Nam, J.M., Yun, J.M., and Song, Y.S. (2009), “Estimation to the Strength of Basalt in Jeju Island according to Rock Failure Criterions”, The Journal of Engineering Geology, Vol.19, No.2, pp.153-163.
20
20.Yang, S.B. (2014), “Comparative Study on Physical and Mechanical Characteristics of Volcanic Rocks in Jeju Island”, Journal of the Korean Geotechnical Society, Vol.30, No.11, pp.39-49.
21
21.Yang, S.B. (2015a), “Physical and Mechanical Characteristics of Basalts in Northwestern and Southeastern Jeju Island”, Journal of the Korean Geotechnical Society, Vol.31, No.7, pp.41-52.
22
22.Yang, S.B. (2015b), “Cohesion and Internal Friction Angle of Basalts in Jeju Island”, Journal of the Korean Geotechnical Society, Vol.31, No.11, pp.33-40.
23
23.Yoon, S.H. and Ko, K.W. (2011), Topography, Geology and Underground Water in Jeju Island, Nae Ha Publishing Company, pp.5-57.
페이지 상단으로 이동하기